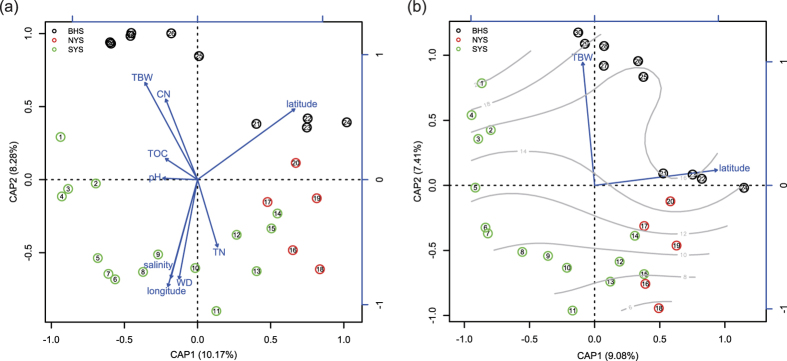
Figure 6. Distance based redundancy analysis (db-RDA) of Bray-Curtis distance on normalized and transformed abundance data.
Three sampled regions are indicated with the black (the BHS), red (the NYS) and green circles (the SYS), respectively. Rectangles represent spatial or environmental factors. (a) The db-RDA ordination without variable selection tests. (b) The db-RDA ordination after variable selection tests. Gray lines indicate surface fitting of TBW.

