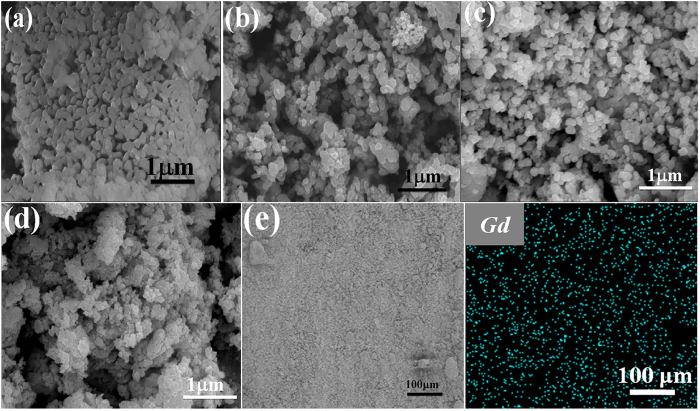
Figure 2.
SEM images of as-prepared samples: (a) BFO; (b) Gd1%-BFO; (c) Gd3%-BFO; (d) Gd5%-BFO; (e) Gd elemental mapping of Gd3%-BFO sample; and (f) EDS spectra of Gd3%-BFO sample. (Note: the labeled elements of carbon (C) and platinum (Pt) in the EDS pattern should be detected from the conductive tape and sprayed metal during the specimen preparation for SEM measurement, respectively).

