
Figure 2. ROC curves for discriminating high-risk (HR) vs. low-risk (LR) newborns.
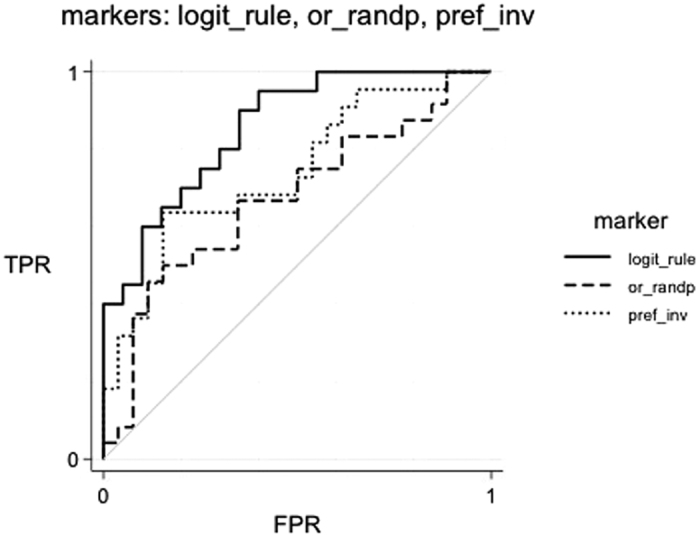
ROC curves discriminate high-risk (HR) vs. low-risk (LR) newborns by different criteria: the percentage of visual preference for the inverted face-like pattern (Preference Inverted), the percentage of number of fixations toward the random motion pattern (Fixations random), and the criterion estimated from the logit function (Logit rule). AUC (Area under ROC curve): Preference inverted, 0.74; Fixations random, 0.72; Logit rule, 0.85. FPR = False Positive Rate; TPR = True Positive Rate.