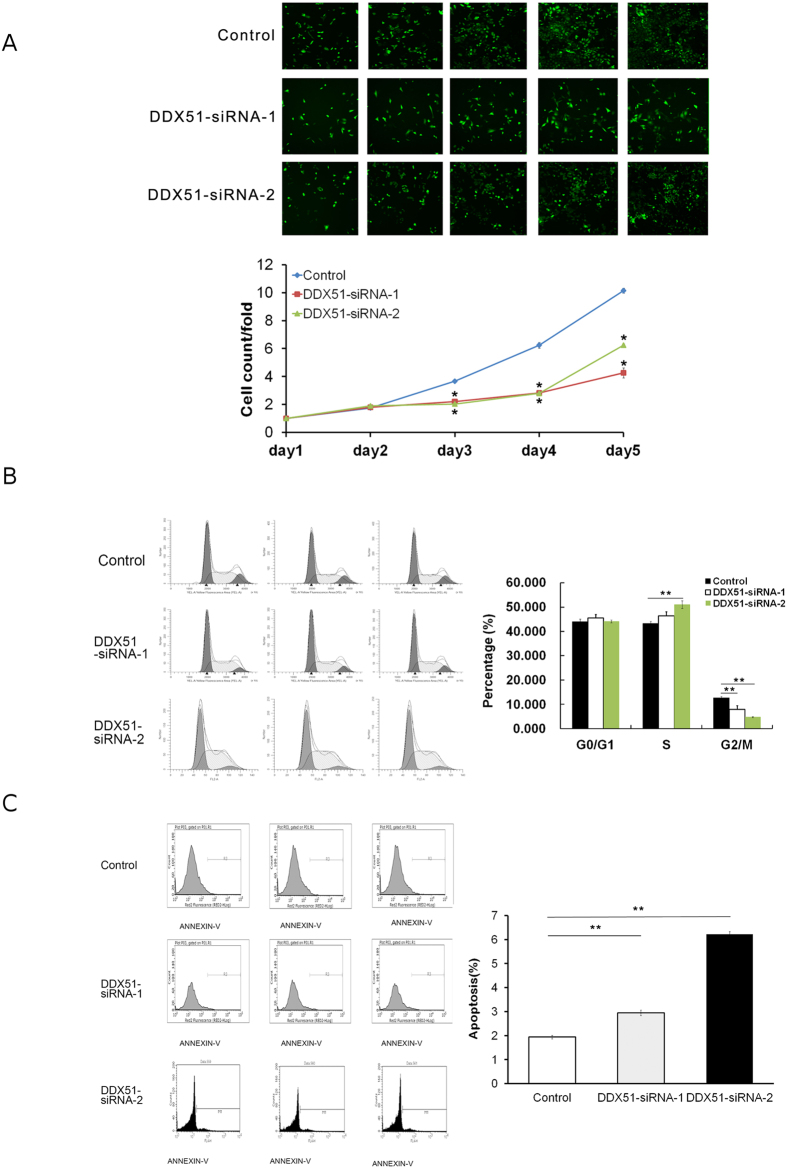
Figure 1. Effects of knocking down DDX51 on cell proliferation, the cell cycle, and apoptosis.
(A) Cellomic assay pictures and fluorescence quantification over 5 days after transfection in mock transfected and two DDX51-siRNA H1299 cell lines. (B) Cell cycle analysis using FACS in mock transfected and two DDX51-siRNA H1299 cell lines. Graphs illustrate representative examples. Bar graphs indicate the mean percentages. (C) Apoptosis was analysed in mock transfected and two DDX51-siRNA H1299 cell lines using FACS after staining with annexin V. Graphs show representative examples and report the values of three biological replicates. Bar graphs indicate the mean percentage values. Error bars, standard error. *P < 0.01.

