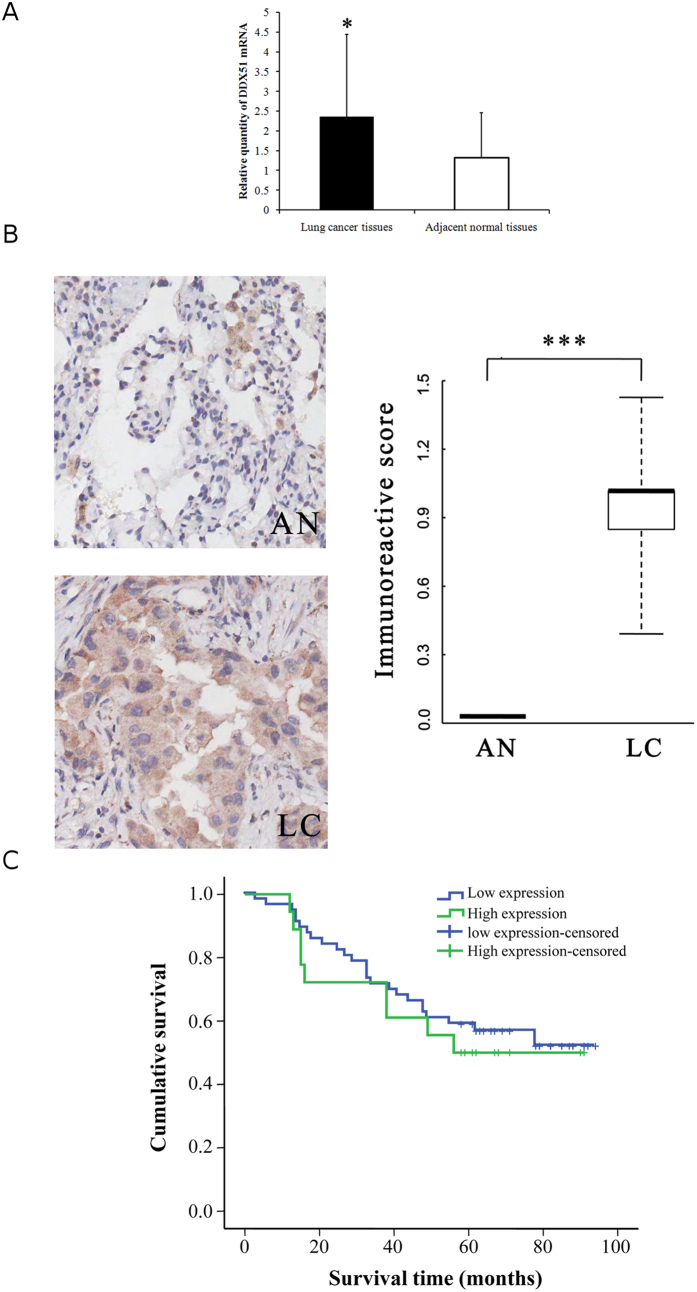
Figure 5. Analysis of DDX51 expression and the correlation between DDX51 expression and survival in cancer patients.
(A) RT-qPCR analysis of DDX51 expression in lung cancer and adjacent normal tissues. The relative levels of DDX51 mRNA in lung cancer tissues was normalized to GAPDH and compared with the expression in adjacent normal tissues. Graphs show the mean values of three biological repeats. (B) Immunohistochemical analysis of DDX51 expression in lung cancer and adjacent normal tissues. Semi-quantitative analysis of the stained sections was performed using light microscopy to calculate the immunoreactive score (see methods). AN, adjacent normal tissues; LC, lung cancer tissues. Kaplan–Meier curve showing the relationship between DDX51 expression and the survival of lung cancer patients. Graphs show the mean percentage values. Error bars, standard error. *P < 0.01.

