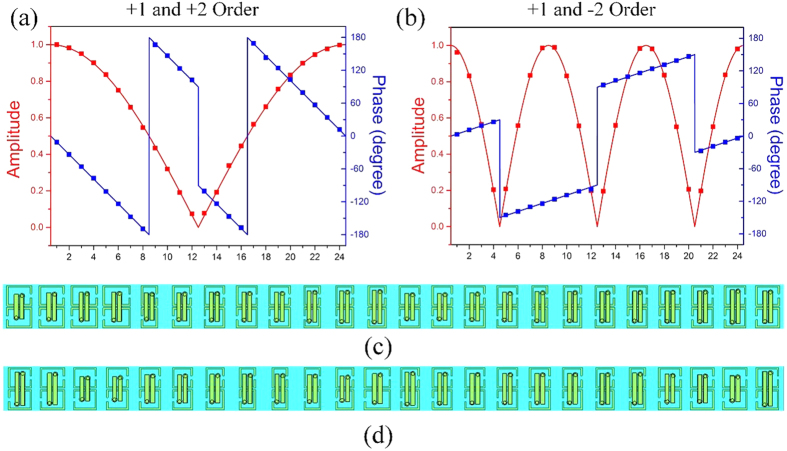
Figure 6. Amplitude and phase profiles of the metasurface gratings.
Solid lines represent the calculated values, and symbols represent the designed values by using different particles. (a) Metasurface grating with m = +1 and m = +2; (b) Metasurface grating with m = +1 and m = −2; (c) One period of the simulation model of the metasurface grating with m = +1 and m = +2; (d) One period of the simulation model of the metasurface grating with m = +1 and m = −2.

