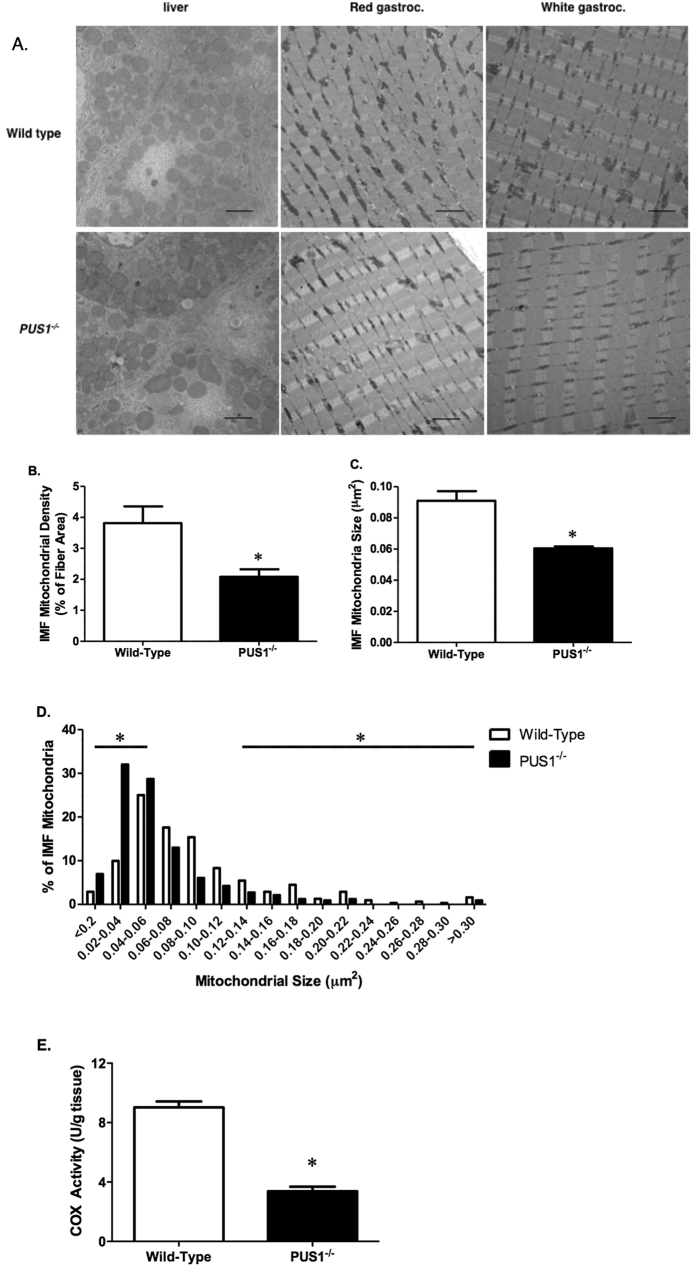
Figure 7. Transmission electron micrographs of liver and muscle samples in wild-type and Pus1−/− mice.
(A) Representative transmission electron micrographs (10,000X) of liver (left column), and the primarily red (middle column) and white portions (right column) of the gastrocnemius muscle from wild-type and Pus1−/− mice. The scale bar on the photograph represents 2 microns. (B) The intermyofibrillar (IMF) mitochondrial density of the red portion of the gastrocnemius muscle in wild-type and Pus1−/− mice. Data are presented as the percentage of mitochondrial area per total fiber area. (C) The IMF mitochondria size (μm2) of the red portion of the gastrocnemius muscle in wild-type and Pus1−/− mice. Data are presented as the total mitochondrial size divided by the total fiber area. (D) The IMF mitochondria size (μm2) distribution of red gastrocnemius muscle in wild-type and Pus1−/− mice. Muscles from 3 animals per group were examined (~100 IMF mitochondria per animal). An asterisk (*) indicates the results for Pus1−/− mice are significantly different from wild-type mice at p < 0.05. (E) Cytochrome c oxidase (COX) activity of the red portion of the gastrocnemius muscle in wild-type and Pus1−/− mice. An asterisk (*) indicates the results for Pus1−/− mice are significantly different from wild-type mice at p < 0.05.

