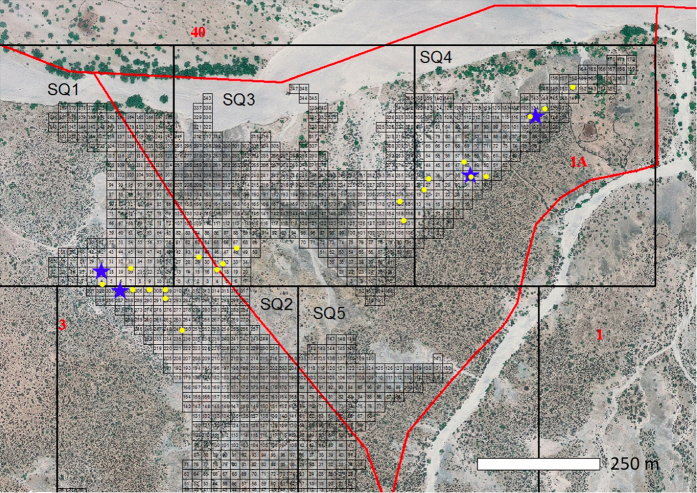
Figure 5. Random sampling of test square locations.
Large grid squares (500 m2; SQ#) divide the collection areas (bounded in red). Smaller numbered squares overlay exposed Okote Mb. deposits and were used to assemble a sample of unbiased sites. Random numbers were generated in proportion to the number of Okote Mb. sub-units in each large square and surveyed for tracks. If a single track of any species was found within 50 m of the target unit, a test square was gridded and excavated (locations in yellow). 41% of randomly chosen units contained tracks. The distribution of sites reflects the concentration of sediment exposures. Larger targeted excavations are shown with blue stars. Map: ArcGIS version 10.2.

