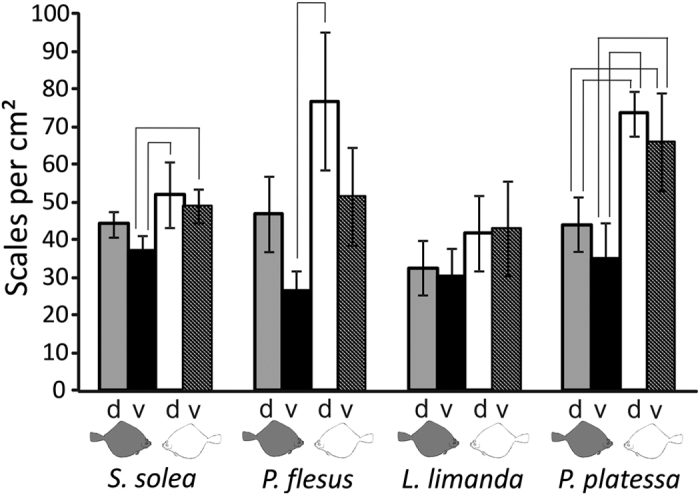
Figure 1. Scale density of S. solea, P. flesus, L. limanda, and P. platessa.

Scale density on the dorsal (d) and ventral (v) part of the eye side (gray fish symbol) and blind side (white fish symbol). Standard deviation is presented by error bars. Brackets indicate significant differences (One-Way ANOVA, P ≤ 0.001; multiple comparison procedures Holm-Sidak method, P < 0.05).
