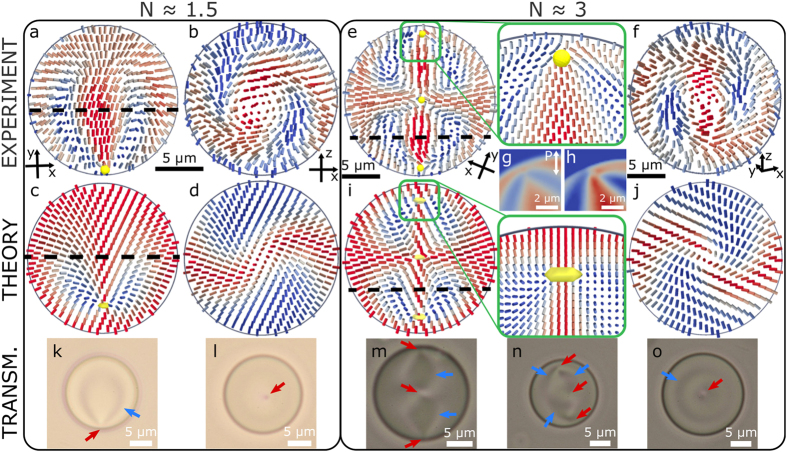
Figure 2. Comparison of experimentally reconstructed and numerically simulated director structures in chiral nematic droplets with one and three point defects.
(a) Cross section of the reconstructed director field in a droplet with a single point defect in the equatorial plane at N ≈ 1.5. (b) Cross section taken along the dashed line in (a). (c) Numerical simulation for N ≈ 1.5 gives the same topology as experimentally observed in (a). (d) Cross section along the dashed line in (c). (e) Three collinear point defects are observed in the reconstructed director of a droplet with increased chirality parameter N ≈ 3.0. The inset shows a zoom-in of the off-centre point defect. (f) Reconstructed director in a cross section taken along the dashed line in (e). (g) The intensity of a single polarisation P close to the upper defect in (e). (h) Total FCPM intensity of the defect in (g). (i) Numerically calculated director corresponding to the reconstructed director in (e) at N = 2.0. (j) Cross section taken along the dashed line in (i). All cylinders are coloured by Inorm or the size of the director projection on the xy plane. In experimental images the point defects are marked with yellow spheres and in theoretical ones with yellow isosurfaces corresponding to S = 0.5. (k–o) Transmission microscopy pictures of droplets with different orientations of the symmetry axis. Panels (k,m) show droplets with the symmetry axis in the image plane, (l,o) perpendicular to the image plane and, (n) with the symmetry axis tilted out of the image plane. Locations of point defects are marked with red and of cholesteric layers with blue arrows.

