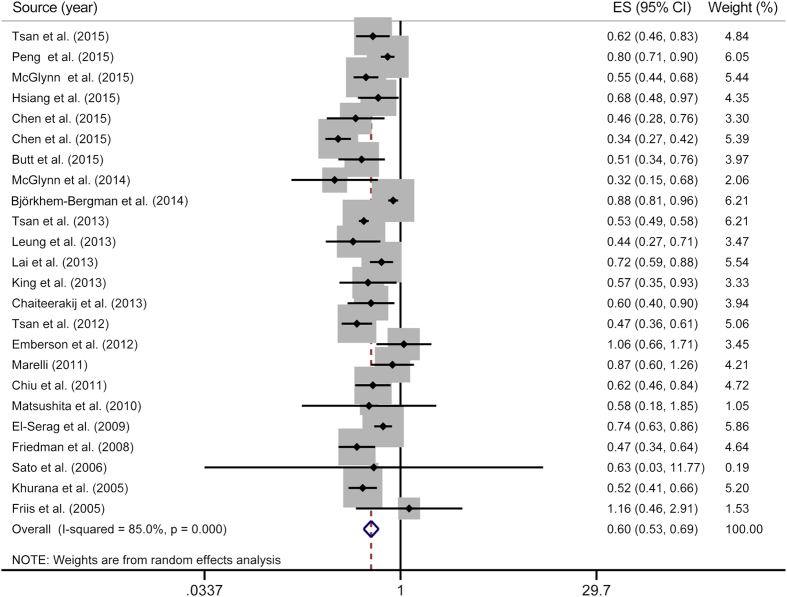
Figure 2. Overall meta-analysis on statin use and primary liver cancer risk.
The squares represent the risk estimate for each individual study, with the area reflecting the weight assigned to the study. The horizontal line across each square represents the 95% confidence interval. The diamond represents the summary risk estimate, with width representing 95% confidence interval. CI, confidence interval; ES, effect size.

