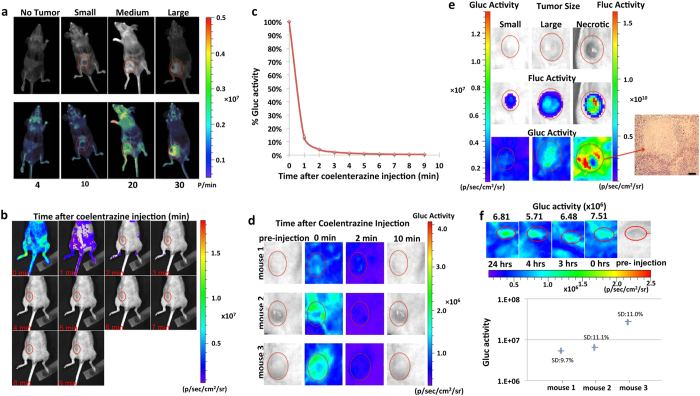
Figure 1. Optimization of rGluc assay to image tumor vascularity.
(a) Increasing number of U87 cells or PBS (control) were implanted in nude mice (n = 4). Two weeks later, mice were injected with rGluc followed by coelenterazine and imaged using a CCD camera. Gluc signal in photons/min (p/min) for different tumor sizes is indicated. Overlay of light with bioluminescence (top) or pseudocolor (bottom) images are shown. (b–d) Tumor-bearing mice (n = 3) were injected with rGluc followed by coelenterazine retro-orbitally and images were acquired every minute over 10 minutes. Average % of total photon flux (where first minute is set at 100%) ± SD is plotted (b). Bioluminescence imaging from a representative mouse with tumor-associated signal at every time point is shown (c). Bioluminescent images of mice with different tumor sizes are shown at different time points (d). (e) Gluc-based bioluminescence imaging of tumor vascularity as well as Fluc imaging (for tumor volume) was performed for small, large and necrotic tumors; showing an H&E staining of the necrotic tumor; scale bar 200 μm. (f) Repeated imaging of the same mice at four different time points over 24 hrs with standard deviation (SD) presented for each mouse (n = 3). Representative bioluminescence images from mouse 2 are shown in the upper panel.

