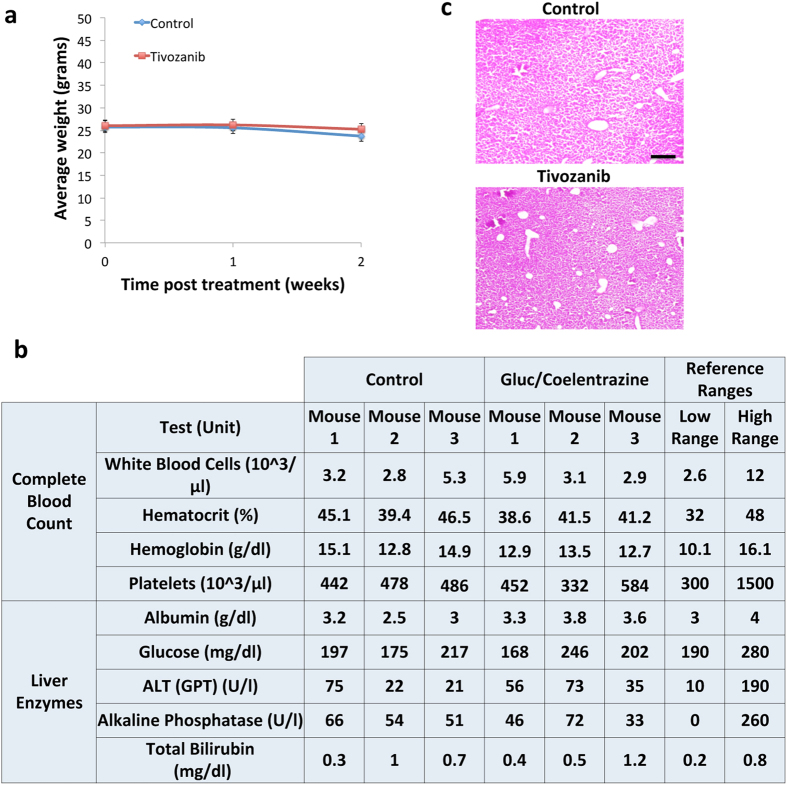
Figure 3. Toxicity analysis of rGluc tumor vascularity assay.
(a) Mice weight from control and tivozanib-treated groups was monitored weekly. (b,c) Mice were injected with rGluc followed by coelenterazine for 2 weeks (3x/week) or PBS (control; n = 3/group). Blood samples were collected from both groups and analyzed for complete blood count and liver enzymes (b). Livers were collected, sectioned, and stained for Hematoxylin and Eosin (c). Shown is a representative liver section staining from each group. Scale bar, 20 μm.

