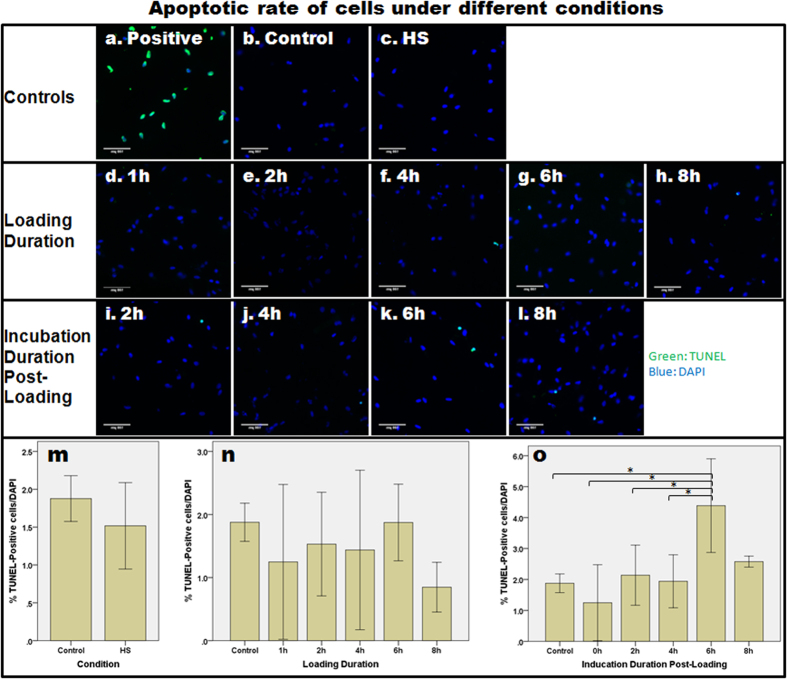
Figure 1. The relative rate of apoptosis in NPCs subjected to different loading durations and incubation durations post-loading was determined using the TUNEL assay.
(a) In the positive control, apoptotic cells were stained with fluorescein and therefore appeared green in colour. (b–i) The rate of apoptosis after static loading with 70% strain with different loading and incubation durations was assessed. (m–o) Bar charts to show the mean ± 2SE level of apoptosis (indicated by % TUNEL-positive cells/DAPI-positive cells). Asterisks indicate statistically significant results (p < 0.05).

