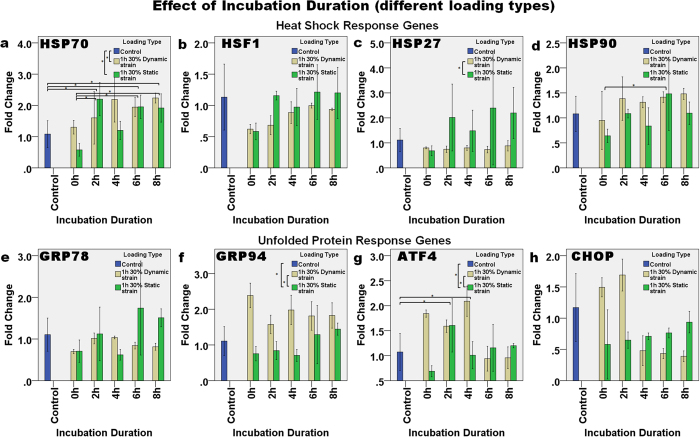
Figure 6. The effect of incubation duration after one hour of either dynamic or static loading on the relative level of gene expression.
The expression of the HSR genes: (a) HSP70, (b) HSF1, (c) HSP27, and (d) HSP90, and UPR genes: (e) GRP78, (f) GRP94, (g) ATF4, and (h) CHOP continued to change with the incubation duration after load removal. Asterisks indicate statistically significant differences (p < 0.05). In each case, the mean ± 2SE fold change of gene expression was normalized to the control without loading. n = 3 for each sample.

