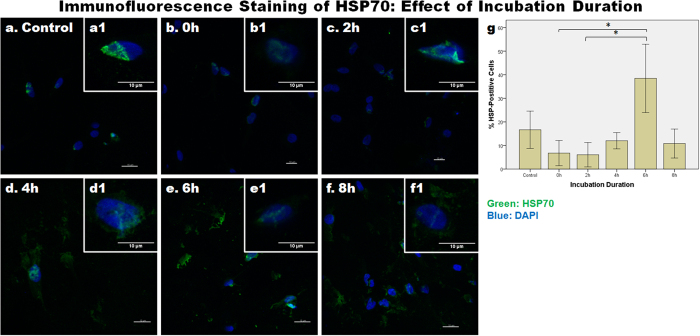
Figure 9. The effect of incubation duration after loading on the expression of HSP70 protein.
Representative images from (a) control and (b–f) various incubation durations following one hour of 70% static strain are shown. (a1–f1) The inserts show magnified views of the nuclei. Sections were immuno-labeled with an anti-HSP70 antibody and the nuclei were labeled with DAPI. Scale bars: 10 μm. (g) Bar chart to show the mean ± SEM percentage of HSP70-positive cells (i.e., calculated from the number of HSP70-positive cells and the total number of cells) at different incubation durations. n = 10 images in each experimental group. The asterisks indicate statistically significant differences (p < 0.05).

