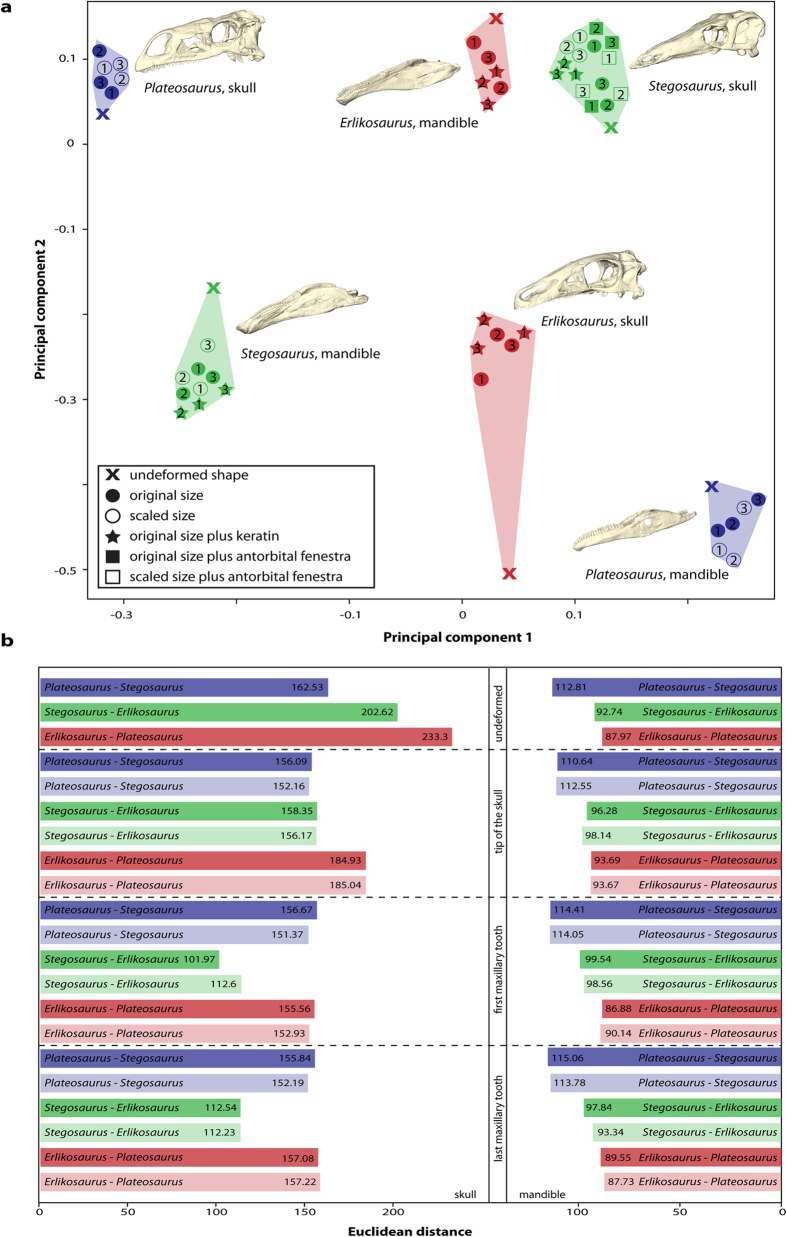
Figure 4. Quantitative assessment of biomechanical differences.
(a) Principal component plot showing extent of deformation of models during biting simulations using FEA. Skull and lower jaw models plotted into the same coordinate system. Numbers indicate bite position (corresponding to Fig. 3): 1, bite at the tip of the skull/dentary, 2, the first maxillary tooth/occluding tooth on dentary, 3, last occluding maxillary/dentary tooth. (b) Calculated Euclidean distances between studied taxa for undeformed models and for different bite scenarios. Pale background colours indicate models scaled to same surface area.

