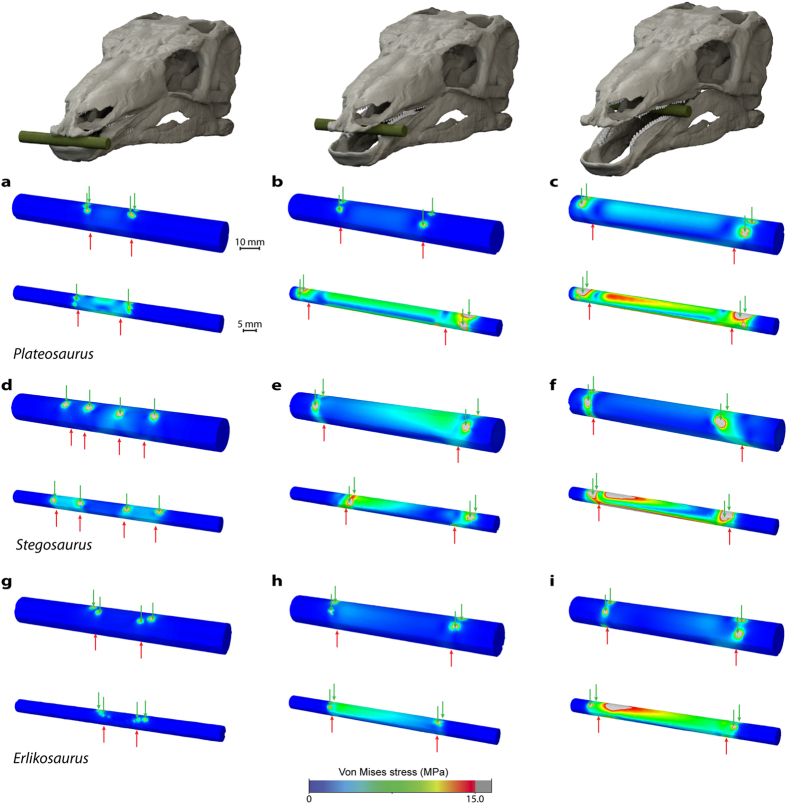
Figure 5. Comparison of Von Mises stress distribution for different sized plant models.
Models of large (10 mm diameter) and small (5 mm diameter) plant items for (a–c) Plateosaurus engelhardti, (d–f) Stegosaurus stenops and (g–i) Erlikosaurus andrewsi subjected to different bite scenarios. From left to right, bite at the tip of the skull/dentary, the first maxillary tooth/occluding tooth on dentary, last occluding maxillary/dentary tooth (loads indicated by red arrows, constraints indicated by green arrows). All models scaled to same surface area.

