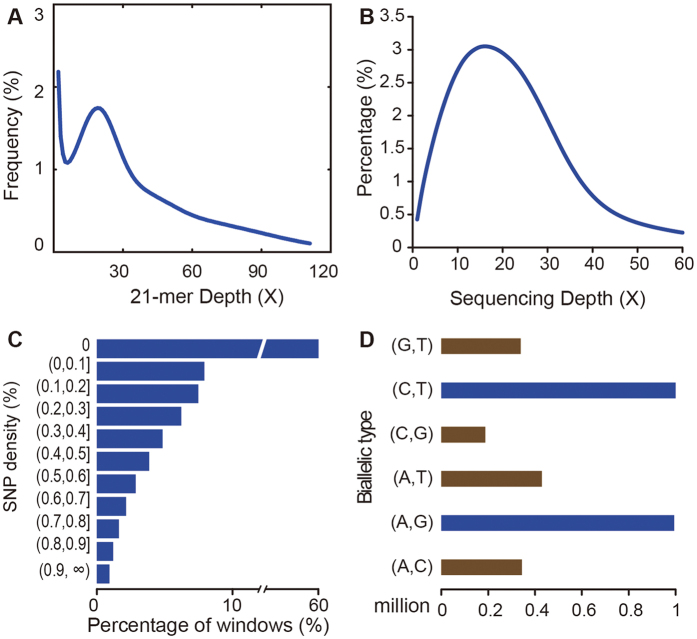
Figure 1. Distribution pattern of 21-mer, sequencing depth, heterozygosity rate and biallelic SNPs.
(A) 21-mer distribution. The y-axis represents the frequency at a given depth divided by the total frequency of all depths. (B) Sequencing depth distribution. The y-axis is the proportion of the base number at each sequencing depth divided by the total sequenced bases. (C) Heterozygous SNP density distribution. Heterozygous SNPs from patchouli diploid genomic data were identified. Non-overlapping 10-kb windows were chosen, and the heterozygosity density was calculated. (D) Biallelic SNP distribution. Blue, transition; brown, transversion.

