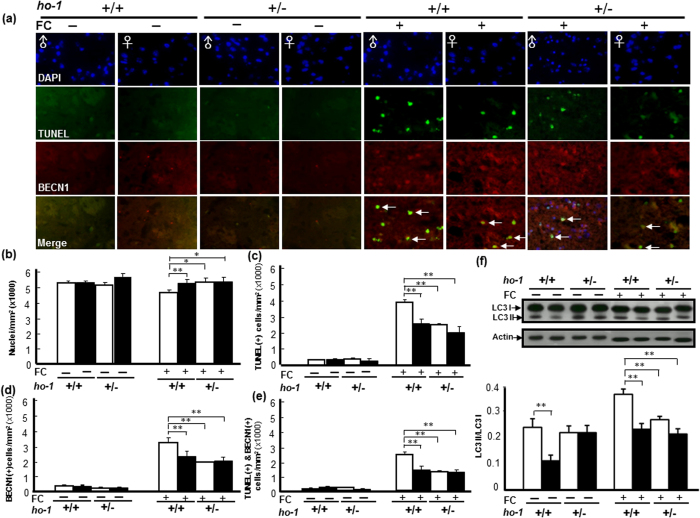
Figure 5. Male specific alleviation of FC-induced autophagic cell death and decrease of autophagy in the striatum by ho-1 KO mice.
(a) Representative images of TUNEL(+) BECN1 immunoreactive cells. (b) Number of nuclei. (c) TUNEL(+) cells. (d) BECN1 immunoreactive cells. (e) TUNEL(+) BECN1 immunoreactive cells. (f) Level of autophagy. The data are expressed as the mean ± SD (n = 6). *indicates p < 0.05, **indicates p < 0.01.

