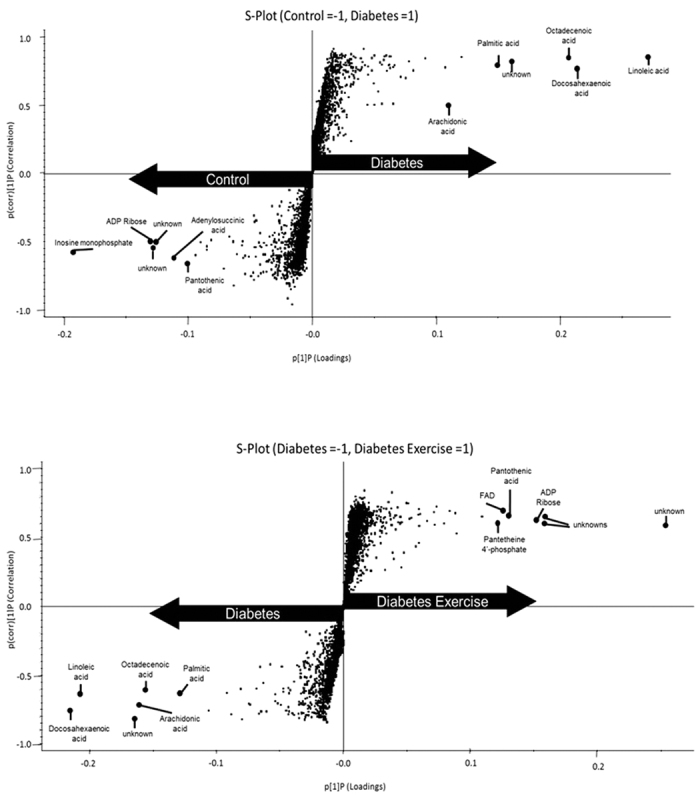
Figure 3. Untargeted metabolomics in the red portion of the gastrocnemius.

S-plot comparison of control (C, n = 5) and sedentary diabetic (D, n = 5) (top). S-plot comparison of (D, n = 5) and diabetes exercise (DX, n = 5) (bottom). The S-plot is a visual method for identification of biomarkers. Variables farthest from the origin in the plot are deemed significant markers. Each biomarker is identified with the elemental composition from the accurate mass and comparison to fragmentation patterns from metabolite databases.
