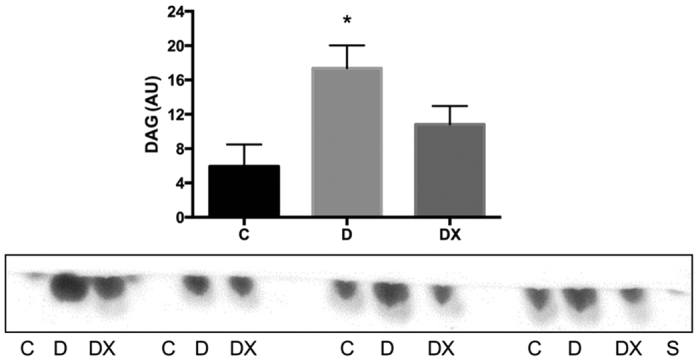
Figure 5. Thin layer chromatography.

Quantification of DAG content in red tibialis anterior muscle in sedentary control (C, n = 4) compared to sedentary diabetic (D, n = 4) and diabetes exercise (DX, n = 4). The D group demonstrated significantly greater DAG content compared to C *(p < 0.05). A representative chromatogram run under the same experimental conditions (see methods) is shown. The representative chromatogram has been cropped to show molecule of interest. Data are expressed as mean ± SE for each group.
