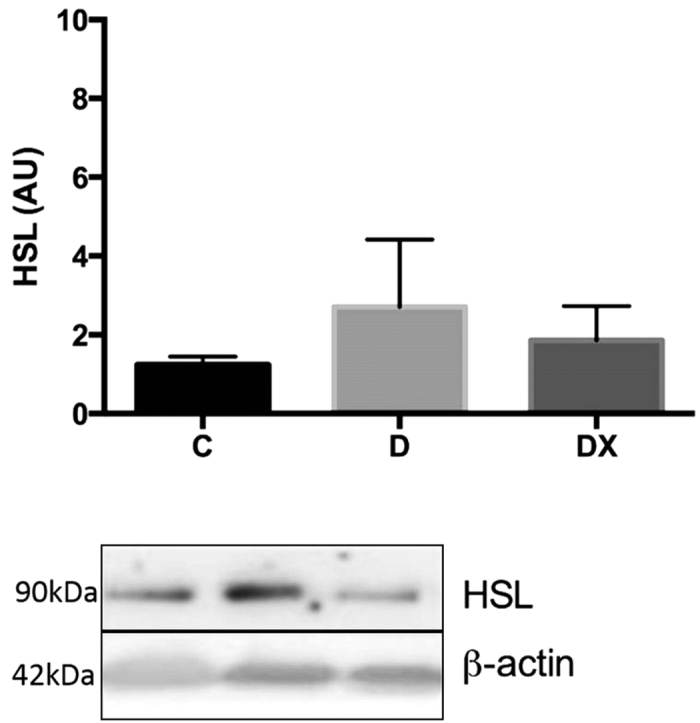
Figure 6. Hormone Sensitive Lipase.

Total soleus HSL protein content in sedentary control (C, n = 6), sedentary diabetic (D, n = 7), and diabetes exercise (DX, n = 6). A representative blot run under the same experimental conditions (see methods) is shown. The representative blot has been cropped to show proteins of interest. There were no significant differences between groups (p = 0.556). Data are expressed as mean ± SE for each group.
