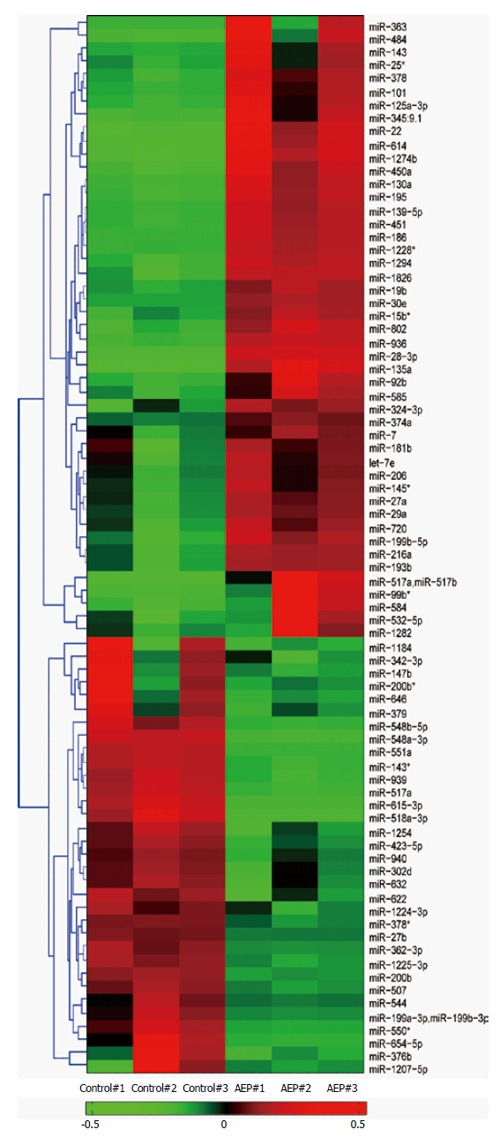
Figure 2.

Hierarchically clustered heat map illustrating the changes in miRNA expression profiles between the acute edematous pancreatitis groups and control groups. The significantly expressed miRNA clusters were identified using the Student’s t-test. The red and green sections represent an increase and a decrease in miRNA expression, respectively, between control group and AEP group. The expression of miR-29a was significantly up-regulated in the AEP group compared with the control group. AEP: Acute edematous pancreatitis.
