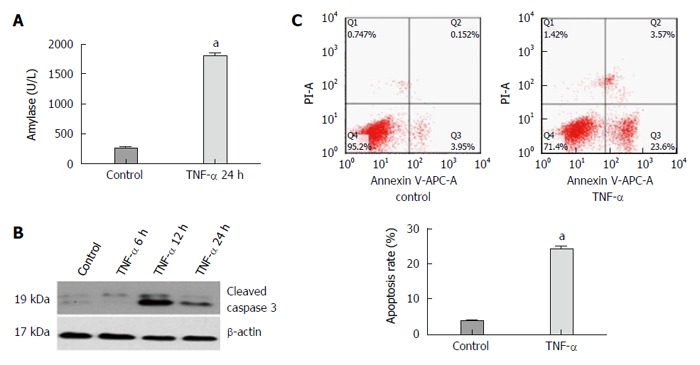
Figure 3.

Expression of amylase, activated caspase 3 protein, apoptosis rate of AR42J cells and miR-29a level increase in the experimental group compared with the control group. A: The expression of amylase analysis in the supernatant; B: Western blot analysis of activated caspase 3 in AR42J cells; C: The apoptosis rate of AR42J cells after the treatment with TNF-α for 24 h. Date were obtained from three independent experiments in triplicate and are shown as the mean ± SD. aP < 0.05 vs control group.
