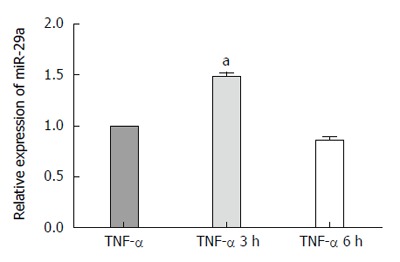
Figure 4.

Quantitative real-time PCR analysis of miR-29a in AR42J cells at 3 h and 6 h. The expression of miR-29a was normalized to U6 expression using 2-ΔΔct. Data were obtained from three independent experiments in triplicate and are shown as the mean ± SD. aP < 0.05 vs control group.
