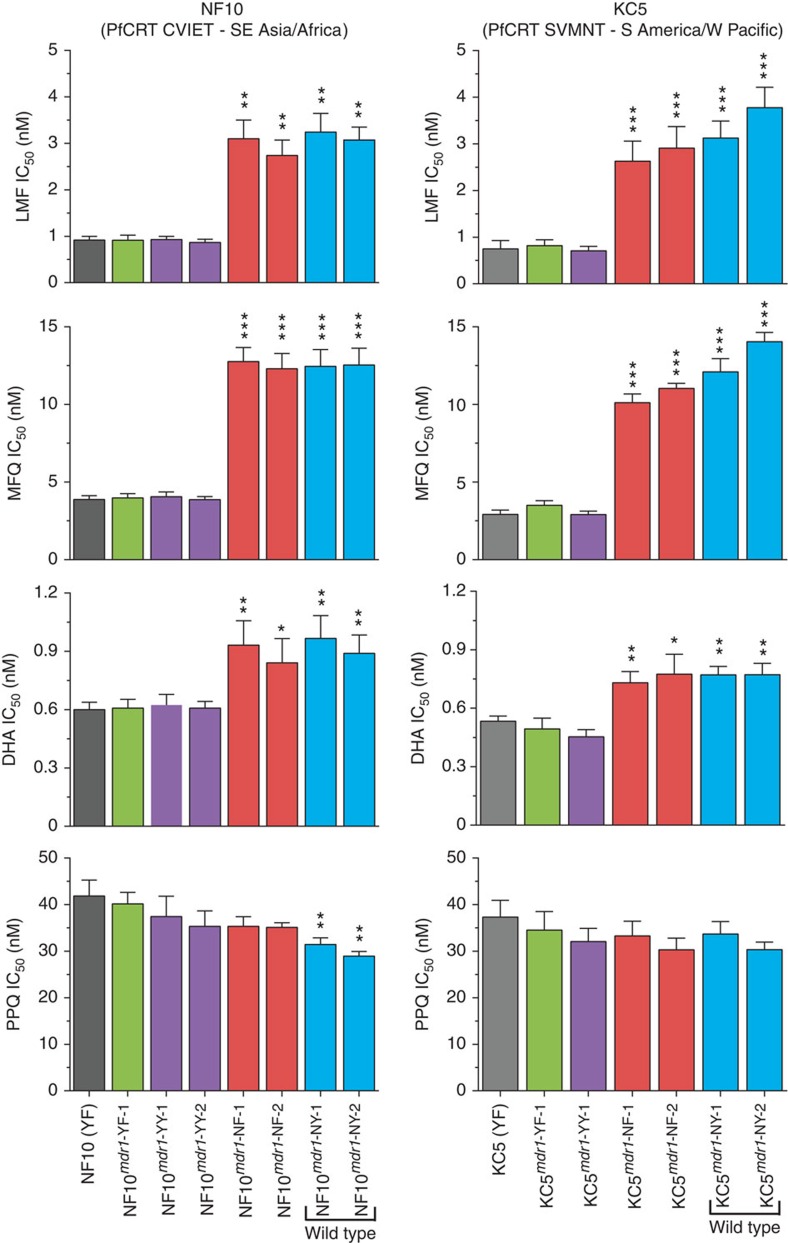
Figure 4. In vitro IC50 response of pfmdr1-modified and parental lines.
IC50 values (nM) were determined by incubating parasites for 72 h across a range of drug concentrations. Parasite growth was determined by measuring parasitaemia using flow cytometry with cells stained with Mito Tracker Deep Red and SYBR Green. Mean±s.e.m. IC50 values are presented for lumefantrine (LMF), mefloquine (MFQ), dihydroartemisinin (DHA) and piperaquine (PPQ). Five to ten assays were performed for each drug (Supplementary Tables 3 and 4). Statistical evaluations comparing mutant pfmdr1-modified lines against recombinant control lines of the same genetic backgrounds (NF10mdr1-YF-1 and KC5mdr1-YF-1 for NF10 and KC5 lines, respectively) were performed using two-tailed Mann–Whitney U-tests. *P<0.05, **P<0.01 and ***P<0.001.

