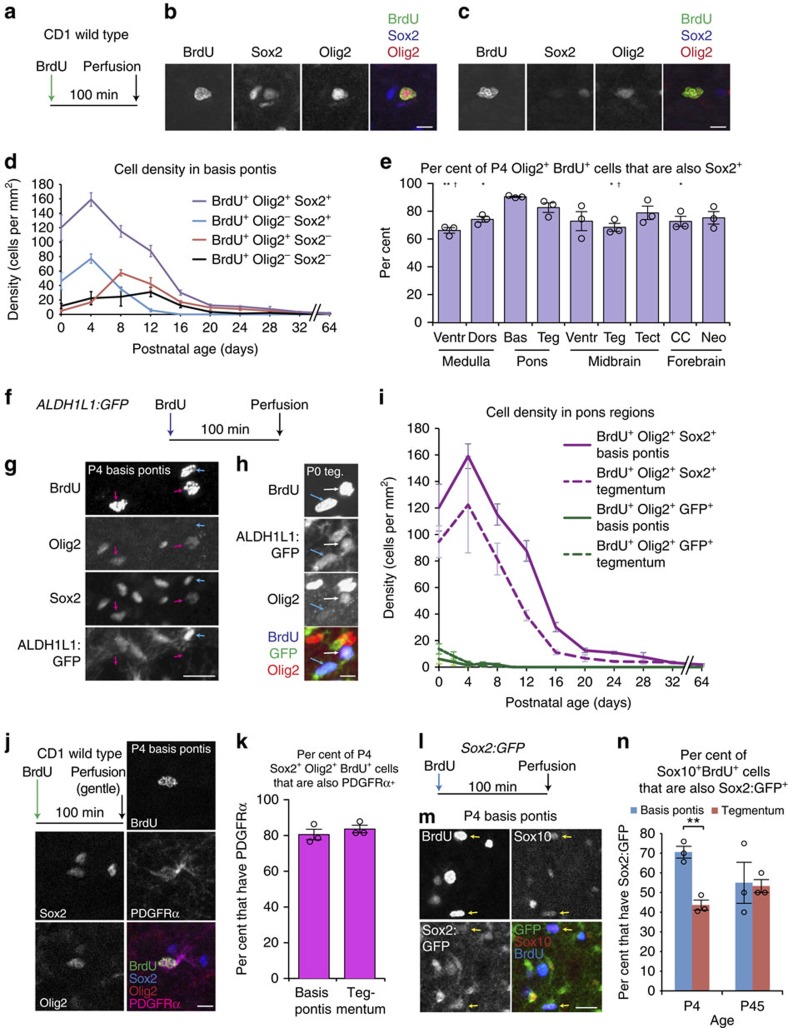
Figure 8. Sox2 is expressed in most postnatal pons OLPs.
(a–e) CD1 wild-type mice received BrdU 100 min before perfusion. (b) Representative P4 Sox2+Olig2+BrdU+ cell. Scale bar, 10 μm. (c) Representative P16 Sox2−Olig2+BrdU+ cell. Scale bar, 10 μm. (d) Breakdown of basis pontis BrdU+ cell density by Sox2/Olig2 co-staining, through postnatal development; mean±s.e.m., n=3 mice per timepoint. Sox2+Olig2+BrdU+ cells outnumber any other cell type (F1,40≥196.91, P<0.0003, Bonferroni-adjusted two-way ANOVA based on cell type and age; tegmentum shown in Supplementary Fig. 7a). (e) P4 tissue from the indicated regions was analysed for the proportion, among total Olig2+BrdU+ cells, of Sox2+Olig2+BrdU+ triple-positive cells; n=3 mice, mean±s.e.m. Unpaired t-test confirmed Olig2+BrdU+ cells were more often Sox2+ in basis pontis than in ventral medulla (P=0.0055), dorsal medulla (P=0.0123), midbrain tegmentum (P=0.0152) or corpus callosum (P=0.0380), and more often Sox2+ in pontine tegmentum than ventral medulla (P=0.0231) or midbrain tegmentum (P=0.0366). *P<0.05 versus basis pontis; **P<0.01 versus basis pontis; †P<0.05 versus pontine tegmentum. (f–h) ALDH1L1:GFP mice received BrdU 100 min before perfusion. (g) Sox2+Olig2+BrdU+ALDH1L1:GFP− cells (pink arrows) and Sox2+ALDH1L1:GFP+BrdU+Olig2− cells (blue arrow) in P4 basis pontis. Scale bar, 20 μm. (h) BrdU+ALDH1L1:GFP+Olig2+ (white arrow) and BrdU+ALDH1L1:GFP+Olig2− (blue arrow) subtypes of proliferative astrocytes in P0 tegmentum. Scale bar, 10 μm. (i) Densities of GFP+Olig2+BrdU+ cells in ALDH1L1:GFP pons, and of Sox2+Olig2+BrdU+ cells in wild-type pons; mean±s.e.m., n=3 mice per strain per timepoint. (j,k) CD1 wild-type mice age P4 were given BrdU as in a, perfused with short postfix (100 min, 4 °C), cryosectioned, and co-stained as indicated. (j) Representative basis pontis OLP; scale bar, 10 μm. (k) PDGFRα was expressed in ∼80% of Sox2+Olig2+BrdU+ progenitors; n=3 mice, mean±s.e.m. (l–n) Sox2:GFP mice received BrdU 100 min before perfusion. (m) P4 pons tissue co-stained as indicated. Yellow arrows indicate representative BrdU+GFP+Sox10+ triple-positive cells. Scale bar, 15 μm. (n) Sox2:GFP pons regions aged P4 or P45 were analysed for the proportion, among proliferative OLPs (Sox10+BrdU+), of cells expressing Sox2:GFP; this percentage was greater in P4 basis pontis than tegmentum (P=0.0026, unpaired t-test); n=3 mice per timepoint, mean±s.e.m., **P<0.01.

