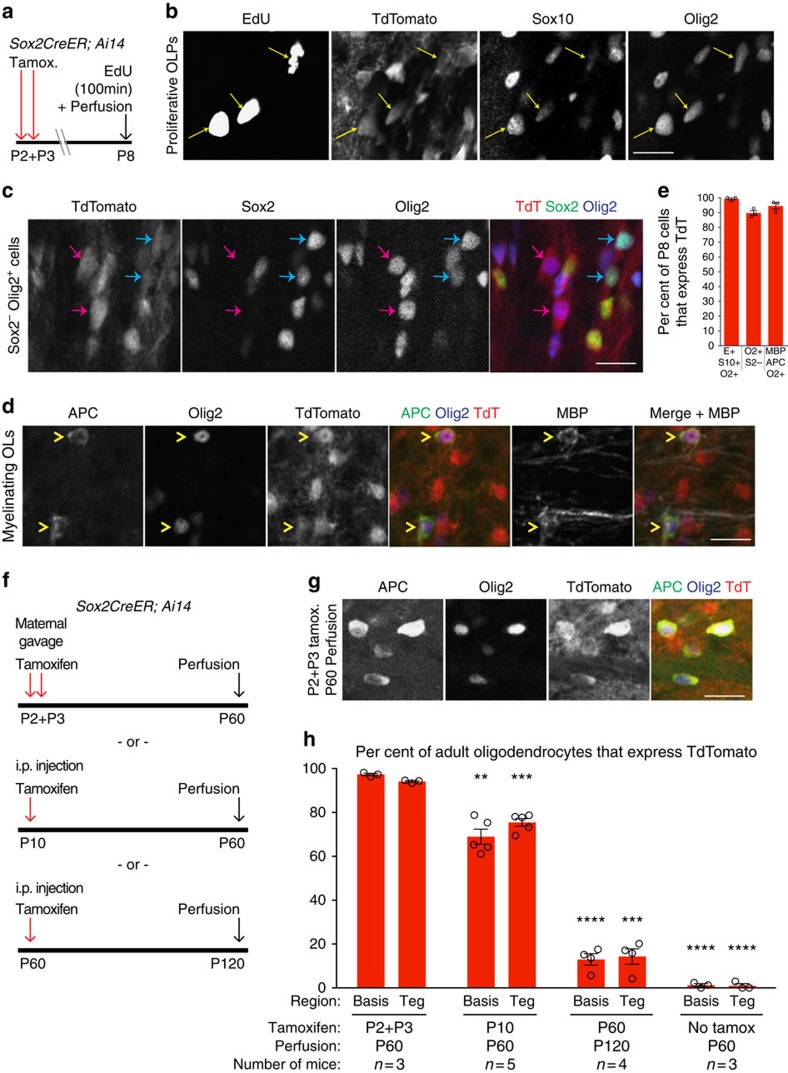
Figure 9. Postnatal Sox2+ progenitors give rise to ∼95% of adult pons OLs.
(a–e) Short-term Sox2CreER fate mapping. Sox2CreER;Ai14 pups were given tamoxifen (by maternal gavage) at age P2 and P3, and EdU intraperitoneally at age P8, 100 min before perfusion. (b–d) TdT+Olig2+ cell types observed in P8 basis pontis; scale bars=20 μm. (b) TdT+Olig2+EdU+Sox10+ proliferative OLPs (arrows). (c) TdT+Olig2+Sox2+ (cyan arrows) and TdT+Olig2+Sox2− cells (magenta arrows). (d) TdT+Olig2+APC+MBP+ myelinating OLs (arrowheads). (e) Quantitation of the proportion of each P8 cell type shown in (b–d) that coexpress TdT, demonstrating origin from postnatal Sox2+ progenitors. Data shown are from basis pontis. ‘E'=EdU, ‘S10'=Sox10, ‘S2'=Sox2, ‘O2'=Olig2. Graph shows individual replicates with mean±s.e.m. of n=3 mice. (f–h) Long-term Sox2CreER;AI14 fate mapping. Tamoxifen induction was performed in one cohort by maternal gavage at P2 and P3, and in a second cohort by IP injection at P10; these two cohorts were perfused at P60. Another cohort received tamoxifen at P60 and was perfused at P120. (g) TdT+Olig2+APC+ mature OLs in adult basis pontis of P2–P3 tamoxifen-induced Sox2CreER;Ai14 mice; scale bar, 20 μm. (h) Quantitation (by pons region and tamoxifen timing) of the proportion of mature OLs (APC+Olig2+) that coexpress TdT, demonstrating origin from Sox2+ progenitors at the indicated postnatal ages. A cohort of no-tamoxifen control mice showed TdT expression in∼1% of adult pons OLs. Graph shows individual replicates with mean±s.e.m. of the indicated n mice. **P<0.01, ***P<0.001, ****P<0.0001 (unpaired t-test, versus the corresponding region of P2–P3 dosed mice).

