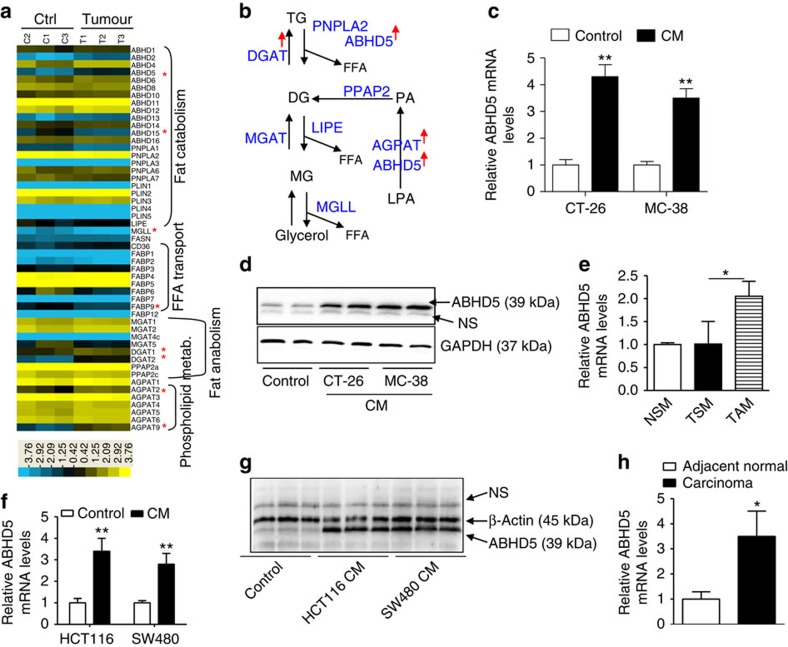
Figure 1. Increased CGI-58 expression in CRC-associated macrophages.
(a) Murine PMs were treated with regular culture medium (Ctrl group) or co-cultured with CRC cells CT-26 (Tumour group) for 24 h and then subjected to gene-microarray analysis. The expression of key genes involved in fatty-acid transport, fat catabolism, fat anabolism and phospholipid metabolism are displayed in a heat map. *Indicates the expression difference between the Ctrl and Tumour groups (n=3, *P<0.05). (b) A diagram of glycerolipid metabolism. The red arrow indicates increased expression of genes in TAMs. (c) Murine PMs were treated with CM from cultured CRC cells CT-26 or MC-38 for 24 h. Then, the mRNA levels of ABHD5 in macrophages were measured by real-time PCR (n=3, **P<0.01). (d) Murine PMs were treated as described in c, and the cellular ABHD5 protein levels were measured by western blotting. (e) Macrophages were isolated from the spleen (TSM) and the tumour tissue (TAM) of CT-26 tumour-bearing mice or from the spleen of normal mice (NSM). The CT-26 cells (5 × 10⁶ cells per mouse) were subcutaneously inoculated at the thighs of BALB/c mice. Ten days later, the tumours and spleens were dissected for macrophage isolation. Then, the ABHD5 mRNA levels in macrophages were measured by real-time PCR (n=6–8, *P<0.05). (f) mRNA assay of ABHD5 in the murine PMs treated with CM from cultured human CRC cells HCT116 or SW480 for 24 h by real-time PCR (n=3, **P<0.01). (g) Immunobloting assay of ABHD5 in the murine PMs treated as described in f. NS, non-specific band. (h) ABHD5 mRNA levels in the macrophages from adjacent normal or carcinoma tissues of human CRC were measured by real-time PCR (n=8, *P<0.05). All the histograms in this figure show means±s.e.m., Student's t-test.

