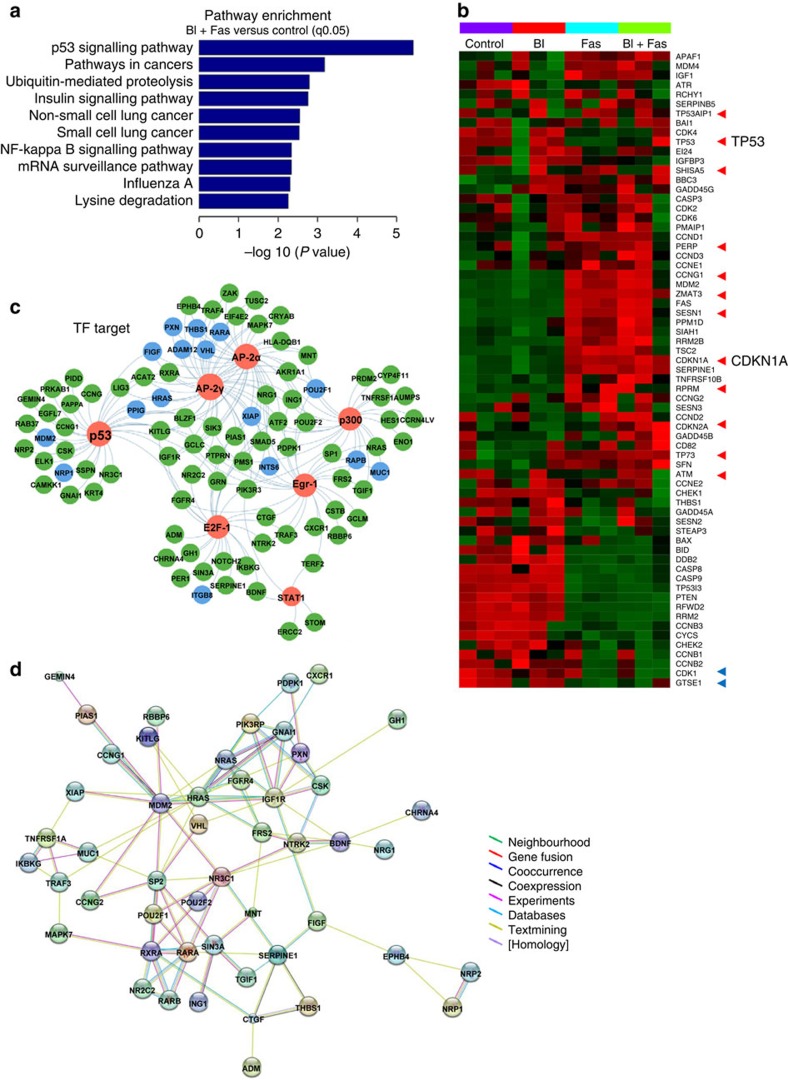
Figure 3. The p53 signalling pathway is involved in the sensitivity of BI-2536/fasudil in KRAS-mutant cancers.
(a) Pathway enrichment of the differentially expressed genes in A549 cells after BI-2536+fasudil treatment. For enrichment analysis, the subsets of upregulated genes were used. The bar plot shows the top 10 enrichment score (−log (P value)) value of the significant enrichment pathway. The P value cutoff was 0.05 and denotes the significance of the pathway correlated to the conditions from three independent experiments. (b) Heatmap coloured according to the Z scores of the expression value, showing the expression profile of all of the genes in the p53 pathway. The arrow points to DEGs with FC≥2 and FDR≤0.05. The red arrows represent genes that are upregulated, and the blue arrows represent genes that are downregulated. TP53 and CDKN1A, primary members of this pathway, are indicated. (c) Differentially expressed disease genes that are explained by enriched TF. Red node, TFs; blue node, non-small cell lung cancer-related genes; green node, lung cancer-related genes. (d) Protein–protein interaction networks, functional modules consisting of the genes downstream of the enriched TF.

