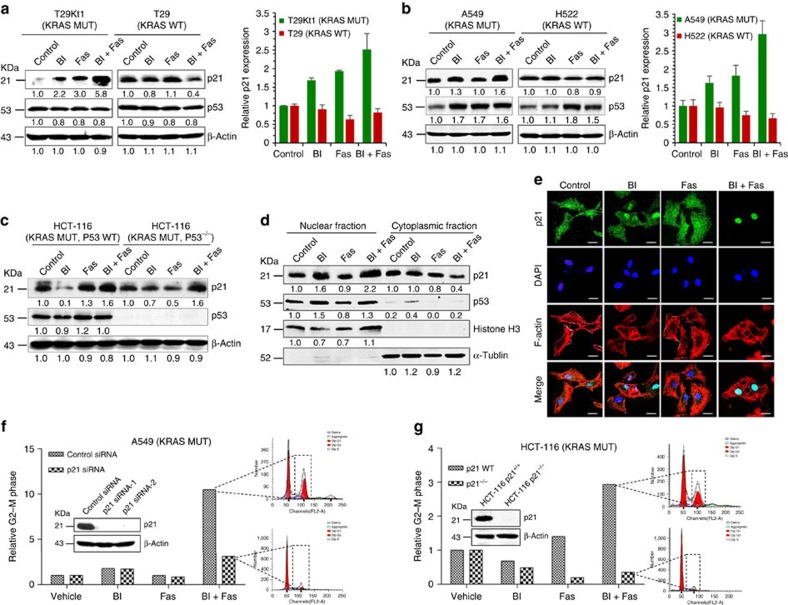
Figure 4. The combined inhibition of PLK1 and ROCK leads to the overexpression of p21WAF1/CIP1 in KRAS-mutant cells but not wild-type cells.
(a) The levels of p21 protein and mRNA expression in isogenic T29Kt1/T29 cells. Cells were treated with DMSO (control), BI-2536 (4 nmol l−1), fasudil (20 μmol l−1) or BI-2536/fasudil. Equal amounts of proteins from cell lysates were subjected to western blotting analyses. The numbers underneath the blotting bands represent the normalized density quantified by densitometry using ImageJ 2 × software. The relative mRNA levels of p21WAF1/CIP1 after normalization to β-actin expression were determined by quantitative PCR. The error bars correspond to the s.d.'s from three independent experiments. (b) The levels of p21 protein and mRNA expression in treated A549 and H522 cells. The error bars correspond to the s.d.'s from three independent experiments. (c) BI-2536/fasudil-mediated p21 activation was independent of p53 regulation. p21 and p53 were probed in isogenic HCT-116 (p53+/+) and HCT-116 (p53−/−) cells. (d) Immunoblot analysis of protein levels in the nucleus and cytoplasm in response to the indicated treatments in A549 cells. Histone H3 and α-tubulin served as nuclear and cytoplasmic fraction markers, respectively. (e) A549 cells were treated as indicated for 16 h. The nuclear accumulation of p21 was determined by immunofluorescence staining. The cells were stained with the anti-p21 antibody (green), nuclei were counterstained with 4,6-diamidino-2-phenylindole (blue) and F-actin was stained with phalloidin (red). Immunofluorescence was recorded using confocal laser fluorescence microscopy. Scale bars, 20 μm. (f) A549 cells were transfected with p21 siRNA or a control siRNA for 24 h, and then exposed to single drugs or to BI-2536/fasudil 48 h. The cell cycle distribution was analysed by flow cytometry using propidium iodide staining. The efficiency of p21 knockdown was examined by immunoblotting. (g) HCT-116 (KRAS mutant and p21 wild type) cells and its p21 knockout counterparts (HCT-116 p21−/−) were exposed to single drugs or to BI-2536/fasudil respectively. The cell cycle distribution was analysed. The efficiency of p21 knockout was examined by immunoblotting.

