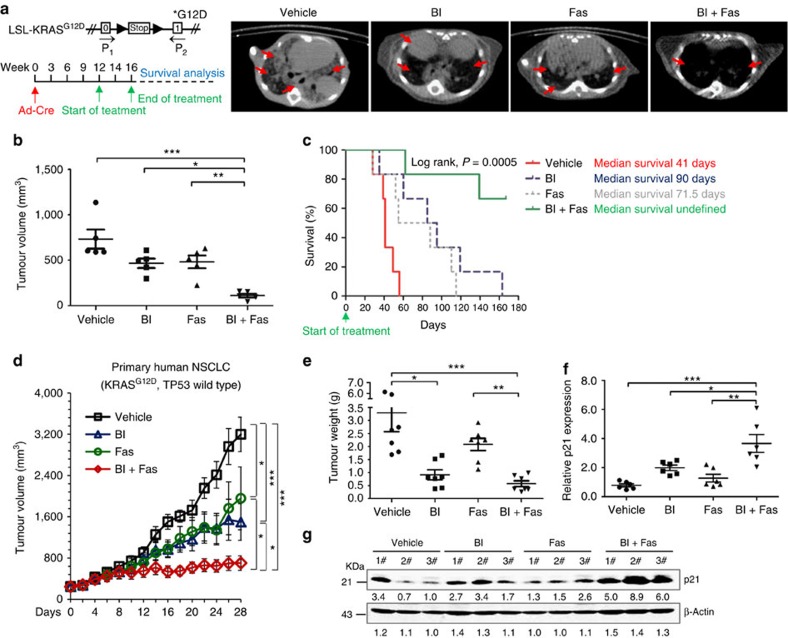
Figure 5. In vivo efficacy of combined PLK1 and ROCK inhibition.
(a) Left: schematic illustration of the LSL-KRASG12D allele and drug treatment protocol. Established lung tumours in LSL-KRASG12D mice were treated with vehicle, BI-2536 (BI), fasudil (Fas) or both drugs in combination (BI+Fas). Right: after 4 weeks treatment, animals were scanned by micro-computed tomography and representative transverse images are shown. Red arrows indicate lung tumours. (b) Mean tumour volume at the end point of the indicated treatments. Each dot represents an individual mice (n=5 per group). Data represent the mean±s.e.m. *P<0.05; **P<0.01; ***P<0.001 by one-way analysis of variance (ANOVA) followed by Bonferroni multiple comparison test. (c) The survival rate was calculated by Kaplan–Meier method (n=6 per group). Statistical significance was assessed by log-rank tests, *P<0.05; **P<0.01; ***P<0.001. (d) The growth of primary NSCLC tumour xenografts (n=8 per group). Data represent the mean±s.e.m. *P<0.05; **P<0.01; ***P<0.001 by one-way ANOVA followed by Bonferroni multiple comparison test. (e) Tumour weights of the primary NSCLC tumour xenografts upon euthanasia at day 28. Each dot represents a tumour from an individual mouse. Data represent the mean±s.e.m. *P<0.05; **P<0.01; ***P<0.001 by one-way ANOVA followed by Bonferroni multiple comparison test. (f) p21 mRNA expression in the primary NSCLC tumour xenografts. Each dot represents a tumour from an individual mouse (n=6 per group). Data represent mean±s.e.m. *P<0.05; **P<0.01; ***P<0.001 by one-way ANOVA followed by Bonferroni multiple comparison test. (g) p21 protein level in the lysates from the tumours in the primary tumour xenograft mice. Each number represents a tumour from an individual mouse. See also Supplementary Fig. 3.

