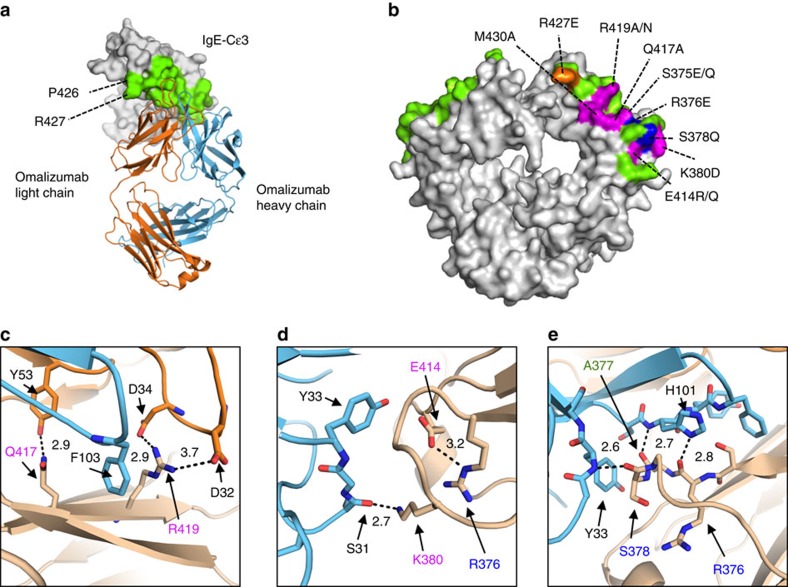
Figure 3. The omalizumab epitope.
(a) A top down overview of the omalizumab:IgE complex, with interface residues coloured green and residues shared between omalizumab:IgE and IgE:FcɛRIα complexes labelled. (b) Position of previously published IgE heavy chain mutants and a new IgE-Fc3–4 mutant (R419N) at the omalizumab interface in green. Mutant residues are colour-coded by their relative binding to omalizumab (magenta 0–14%, blue 15–44% and orange 44–75% of wild-type IgE). (c–e) Detailed view of the omalizumab:IgE interface, with distances (Å) between atoms predicted to participate in hydrogen bonds or salt bridges shown in black. (c) A hydrogen bond between IgE Q417 and omalizumab light chain Y53, and a salt bridge between IgE R419 and light chain D34 and D32. (d) A hydrogen bond between IgE K380 and omalizumab heavy chain S31, and an intrachain salt bridge between IgE E414 and IgE R376, two residues implicated in omalizumab:IgE binding studies. (e) Hydrogen bonds observed between IgE residues R376, A377, S378 and omalizumab heavy chain residues H101 and Y33.

