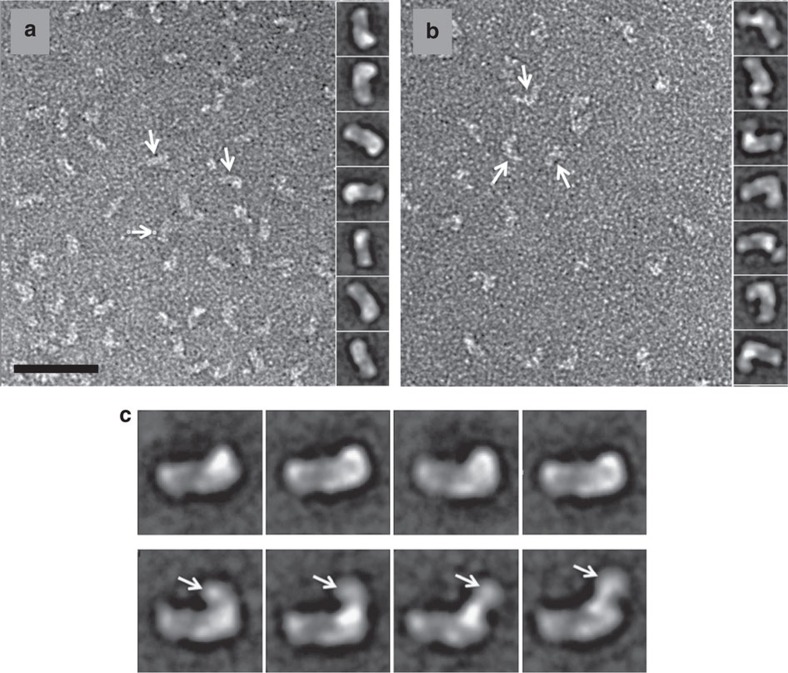
Figure 3. TEM analysis of the HxuA-NtHpx and HxuA-Hpx complexes.
(a) Micrograph of the negatively stained HxuA-NtHpx complex. The arrows indicate the protein particles adsorbed on the carbon film. The right panel shows a representative gallery of class averages from 7,104 particle projections analysed using the EMAN2 software. (b) Micrograph of the negatively stained HxuA-Hpx complex. The arrows indicate the protein particles adsorbed on the carbon film. The right panel shows a representative gallery of class averages from 9,847 particle projections analysed using the EMAN2 software. In c, the arrow indicates the extra density clearly visible on the side views of the HxuA-Hpx complex (bottom) compared with the HxuA-NtHpx complex (top panel). The scale bar in a is 50 nm. The boxes are 18 nm in a and b and 20 nm in c.

