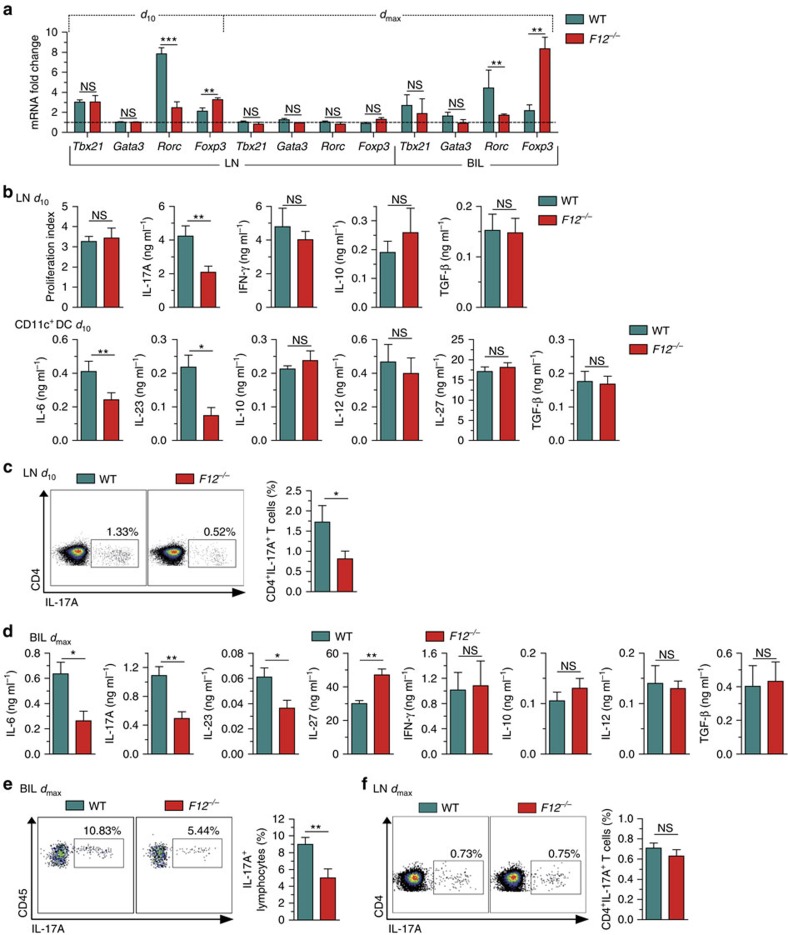
Figure 2. Factor XII deficiency alters T-cell differentiation.
(a) Tbx21, Gata3, Rorc and Foxp3 expression from LN cells at day 10 (d10) or dmax as well as from brain-infiltrating leukocytes (BILs) at dmax after MOG35–55 immunization is determined by real-time reverse transcription–PCR using 18S rRNA for normalization. Data (mean±s.e.m. of five experiments) are given as fold change in normalized gene expression in animals relative to WT controls. (b) At d10 after MOG35–55 immunization, proliferation and cytokine production by CD4+ T cells purified from LN and restimulated with 10 μg ml−1 MOG35–55 and irradiated (35 Gy) antigen-presenting cells in vitro for 48 h (upper panels), and by CD11c+ DCs purified from spleens and incubated with 1 μg ml−1 LPS in vitro for 48 h (lower panels) are shown. (c) Mononuclear cells were isolated from the LN of WT and F12−/− animals at d10 post induction of EAE. Cells were polyclonal restimulated in vitro, stained with anti-CD3 and anti-CD4, fixed and permeabilized, stained intracellularly with anti-IL-17A and analysed by flow cytometry for the percentage of IL-17A-producing CD4+ T cells. (d) Cytokine production by purified BILs from MOG35–55-immunized WT or F12−/− mice at dmax after restimulation with 10 μg ml−1 MOG35–55 for 48 h. (e,f) BILs and LNs were isolated from WT and F12−/− animals at dmax post induction of EAE and polyclonal restimulated in vitro. For the detection of the percentage of IL-17A-producing lymphocytes (CD45highCD11bneg cells or CD4+CD3+ T cells), BILs or LNs were stained with anti-CD11b and anti-CD45, or anti-CD3 and anti-CD4, fixed and permeabilized, stained intracellularly with anti-IL-17A and analysed by flow cytometry. In b–f, data are given as means±s.e.m. of three independent experiments, each performed in triplicate. For c,e and f, representative dot plots for IL-17A expression are shown. For a–f, non-parametric Mann–Whitney U-test. *P<0.05, **P<0.01, ***P<0.001; NS, not significant.

