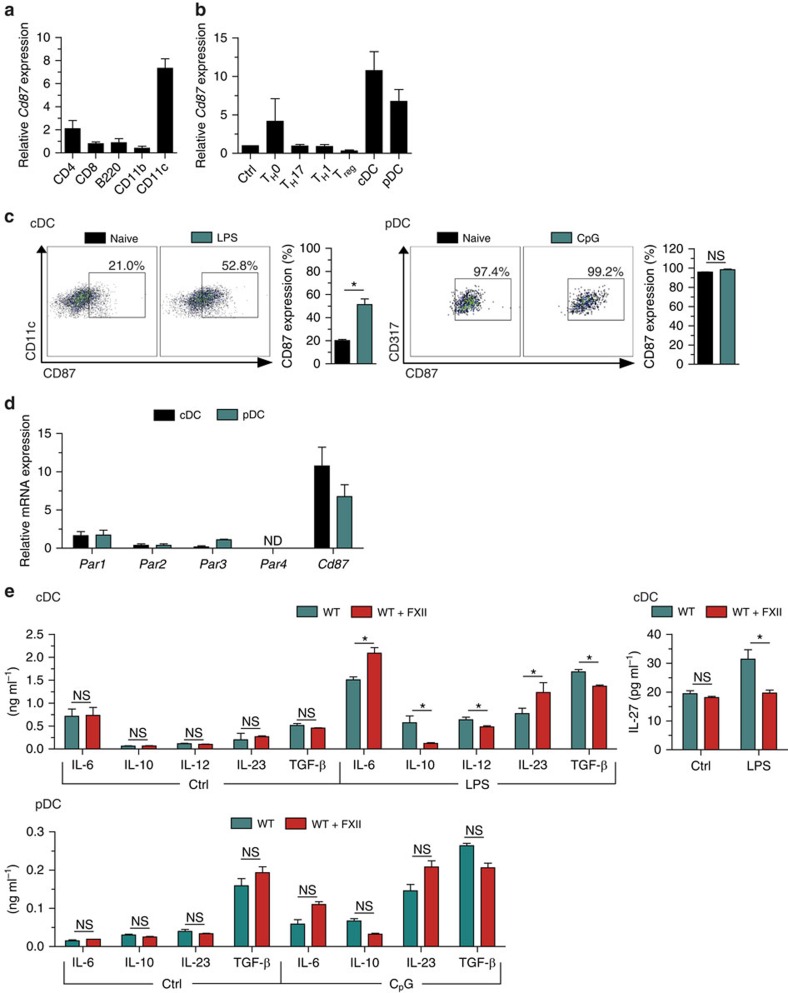
Figure 3. FXII favours the emergence of TH17 cells via DC.
(a) Real-time reverse transcription–PCR (rRT–PCR) analyses for Cd87 gene expression in CD4+, CD8+ and B220+ cells isolated from lymphocytes as well as in CD11b+ and CD11c+ cells isolated from spleens of naive WT mice. (b) rRT–PCR analyses for Cd87 gene expression in CD4+CD25− (Crtl) and CD4+CD25+ (Treg) cells isolated from lymph nodes under basal conditions or after a 48-h incubation with antibodies against CD3 and CD28 under neutral conditions (TH0) or in the presence of the appropriate cytokine and neutralizing antibody mixtures for differentiation into TH1 or TH17 cells as well as in splenic cDCs or pDCs. (c) Flow cytometry analysis for CD87 expression in cDCs (stained with CD11c, left panel) and pDCs (stained with CD317, right panel) isolated from the spleen under basal conditions or after a 24-h stimulation with 1 μg ml−1 LPS or 10 μg ml−1 CpG oligodeoxynucleotide 1,826, respectively. For cDCs and pDCs, representative dot plots for CD87 expression are shown. (d) rRT–PCR analyses for Par1, Par2, Par3, Par4 and Cd87 expression in cDCs and pDCs isolated from the spleen. (e) Splenic cDCs and pDCs from WT animals were incubated with medium only (Ctrl) or stimulated with 1 μg ml−1 LPS (for cDCs) or with 10 μg ml−1 CpG oligodeoxynucleotide 1,826 (for pDCs) in the absence or presence of 60 nM FXII, respectively. After 48 h, cytokine concentrations were measured in culture supernatants. In a,b and d, data are given as mean±s.e.m. of three independent experiments and presented as fold change in transcript expression relative to 18S rRNA. In c and e, data are given as mean±s.e.m. of three independent experiments, each performed in triplicate (non-parametric Mann–Whitney U-test). *P<0.05; ND, not detected; NS, not significant.

