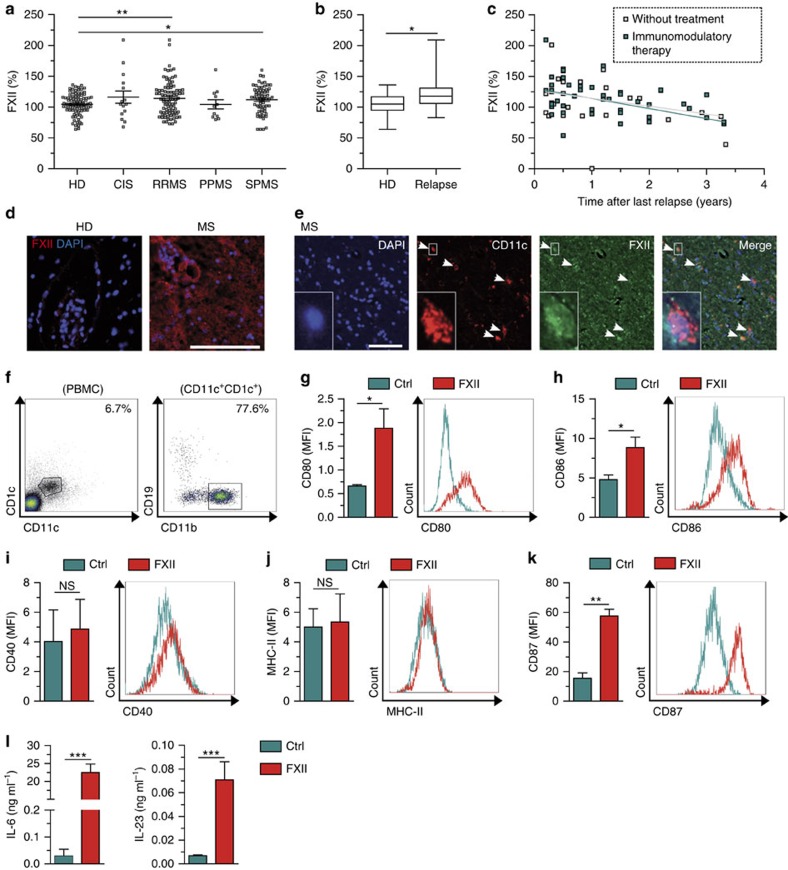
Figure 7. Evidence for the involvement of FXII in human autoimmune CNS inflammation.
(a) FXII plasma levels in individuals with clinically isolated syndrome (CIS) and MS patients (relapsing–remitting MS (RRMS), primary progressive MS (PPMS) and secondary progressive MS (SPMS)) compared with HDs. (b) FXII plasma levels in individuals with RRMS during relapse compared with HDs. (c) Correlation of FXII plasma levels with relapse-free time in individuals with RRMS. R value: −0.4226. (d) Histological analysis of CNS tissue from individuals with MS or from HDs. Sections were stained for FXII (red) and nucleus (4,6-diamidino-2-phenylindole (DAPI), blue). Scale bar, 100 μm. (e) Histological analysis of CNS tissue of individuals with MS. Sections were stained for CD11c (red), FXII (green) and nucleus (DAPI, blue). Scale bar, 100 μm. (f–k) Flow cytometric analysis of human PBMCs from HDs that were incubated with medium only (Ctrl) or stimulated with 60 nM FXII for 24 h. Cells were gated for CD1c+CD11c+CD11b+CD19neg (cDC) based on indicated surface markers (shown in f) and their expressions of (g) CD80, (h) CD86, (i) CD40, (j) MHC-II and (k) CD87 were determined. Representative fluorescence-activated cell sorting plots for indicated surface markers are shown. (l) Cytokine concentrations of IL-6 (left panel) and IL-23 (right panel) in the supernatants of human PBMCs treated with 60 nM FXII or untreated (Ctrl) for 24 h. In a,b and g–l, data are given as mean±s.e.m. (non-parametric Mann–Whitney U-test or Student's t-test). *P<0.05, **P<0.01, ***P<0.001; MFI, mean fluorescence intensity; NS, not significant.

