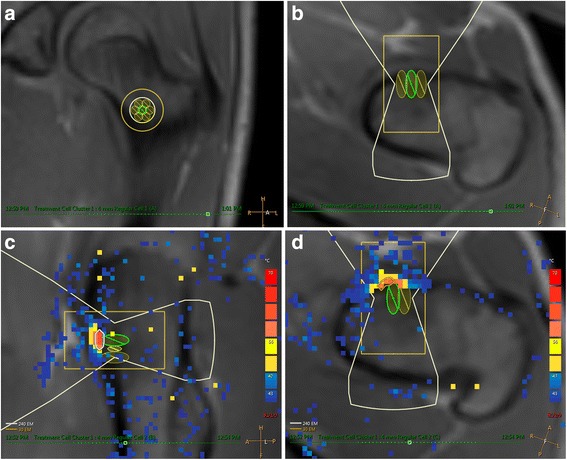
Fig. 5.

Thermography during osteoid osteoma treatment. Planned treatment cells for the osteoid osteoma from Fig. 1 shown in a coronal and b axial MRI views on a Philips Sonalleve platform. (User interface not shown). Seven 4-mm treatment cells were arranged in a circular cluster in the coronal plane to cover the entire 1-cm lesion. Due to electronic beam steering on the Sonalleve machine, the focal zone was positioned at the bone surface in the osteoid osteoma. c Sagittal and d axial images demonstrate thermal maps from a 50-W (1000 J) treatment sonication. This exposure produced a maximum temperature above 60 °C at the bone surface. A small region (approximately 1 × 4 mm) adjacent to the osteoid osteoma reached sufficient temperatures to achieve a thermal dose of 240EM@43 °C, causing necrosis.
