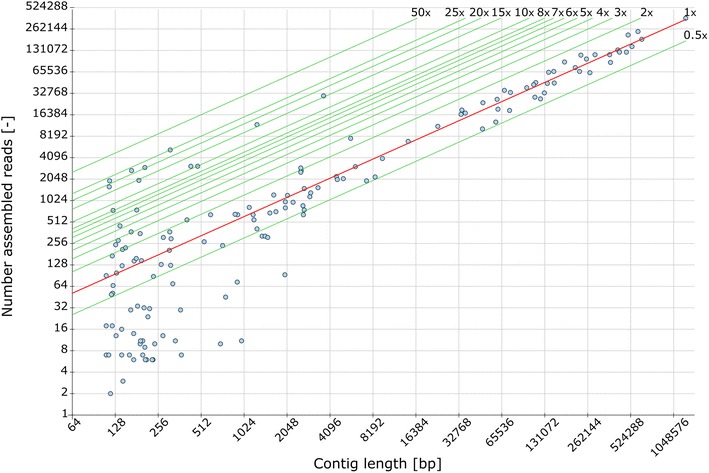
Fig. 2.

“Contig length vs. read-count” plot for the Low-producer strain JPS379 (EMBL FBTF01000000) contigs in log2 scale. Dots represent the length of a contig plotted against the number of reads assembled into that contig. The lines denote the different predicted coverage ranges within the genome. Underrepresented contigs (group I) are found at a coverage of 0.5 or lower and indicate a secondary isolate in the sequenced sample. Unique contigs are represented by the red line, indicating a onefold coverage. Together with the twofold coverage line, they account for group II contigs which make up the chromosome of the main isolate. Above the twofold coverage line contigs belonging to group III can be found. They represent more abundant DNA elements, e.g. mitochondrial DNA
