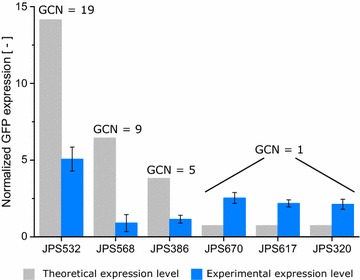
Fig. 6.

Comparison between theoretical and experimental GFP expression for selected over—(JPS532, JPS568 and JPS386) and underachiever (JPS670, JPS617, JPS320) clones. The theoretical values were calculated using the GCN and the equation shown in Fig. 5. Error bars represent the standard deviation, with n = 3 × 3
