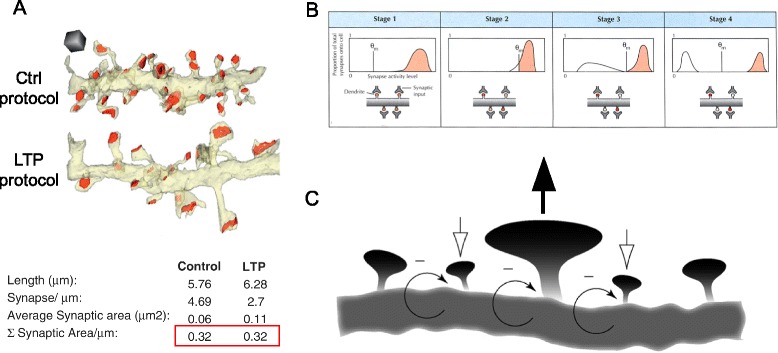
Fig. 3.

Possible mechanisms of synaptic modification in memory storage. a Structural synaptic scaling is analyzed by serial section electron microscopy in hippocampal tissue under control and LTP (induced via theta burst stimulation) conditions. Control and LTP dendrites have equal postsynaptic areas (red outline) despite differences in synaptic density and size. Adapted from [72], with permission. b Representation of metaplasticity occurring, shifting the plasticity threshold (θ m). The graphs on the top row depict the distribution of synaptic responses, red shading indicating LTP and white shading LTD. The four synapses illustrated (bottom row) reflect how the shifting of θm would impact the strength of individual synapses (intensity of red shading correlating to strength). Stage 1 depicts a saturating event, where all of the synaptic strengths have been excited to levels above θm. Stage 2 shows a metaplastic response to the activity levels reached in stage 1. In stage 2, θm has shifted such that some synapses are below the new threshold and weaken in stage 3. This changed θm leads to a new stable state, illustrated in stage 4. Reproduced from [75], with permission. c Synaptic potentiation at one spine (center, upward-pointing black arrow added for emphasis) is predicted to temporarily increase activity at adjacent spines. In response to the increased activity, homeostatic plasticity weakens the entire area (negative feedback arrows), with closely neighboring spines being disproportionately weakened (downward-pointing white arrows). The weakened spines allow the overall dendritic length to maintain a constant level of activity with the central spine still maintaining a level of potentiation. Adapted from [76], with permission
