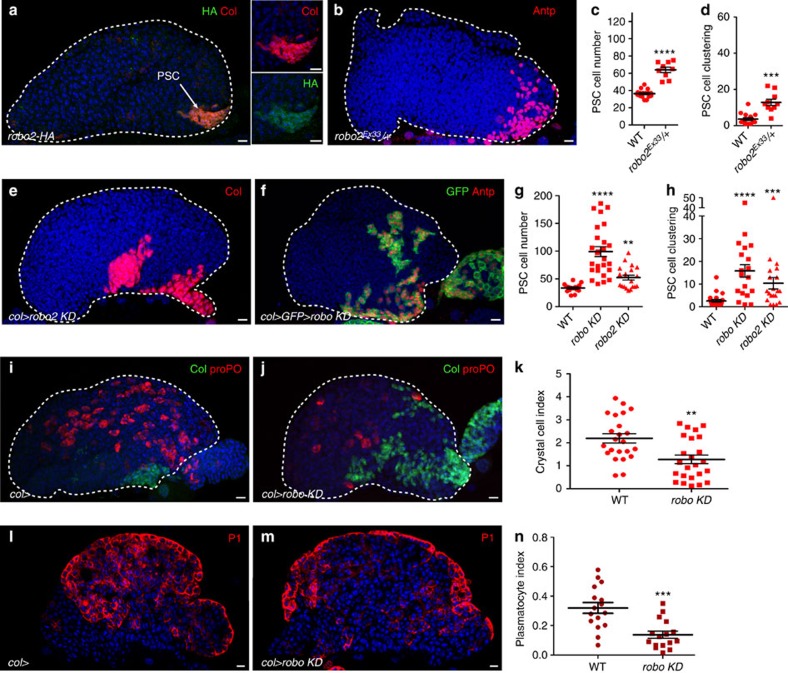
Figure 1. Robo2 receptor is expressed in PSC cells and Robo signalling controls PSC cell number, clustering and function.
(a) Robo2-HA (HA, green) in the LG is expressed in PSC cells marked by Col (red). Smaller panels provide enlarged views showing co-localization of Col with Robo2-HA. (b) robo2Ex33/+ heterozygous mutant LGs display a larger and disrupted PSC as stained by Antennapedia (Antp, red). (e,f) PSC cells are stained by Collier (col, red, e) or Antp (red, f) or express mcd8-GFP (col>GFP, green, f). Reducing robo2 (robo2 KD) (e) or robo1, 2 and 3 simultaneously (robo KD) (f) in the PSC leads to an increased number of PSC cells and their deficient clustering. (c,g) Quantification of PSC cell numbers. (d,h) Quantification of PSC cell clustering. (i,j) WT (i) and robo KD (j) LGs stained for PSC cells (Col, green) and crystal cells (proPO, red). Compared with WT LGs, (i) fewer crystal cells differentiate in robo KD lymph glands (j). (k) Crystal cell index. (l,m) A confocal section in the middle of the LG of WT (l) and robo KD (m) LGs stained for plasmatocytes (P1, red). Compared with WT LGs (l) fewer plasmatocytes, localized at the LG's cortex, differentiate in robo KD lymph glands (m). (n) Plasmatocyte index. Statistical analysis t-test (Mann–Whitney nonparametric test) was performed using GraphPad Prism 5 software. For all quantifications and in all figures: error bars represent s.e.m. and *P<0.1; **P<0.01; ***P<0.001; ****P<0.0001 and NS (not significant). In all figures nuclei are labelled with Topro or 4,6-diamidino-2-phenylindole (blue). Scale bars, 10 μm.

