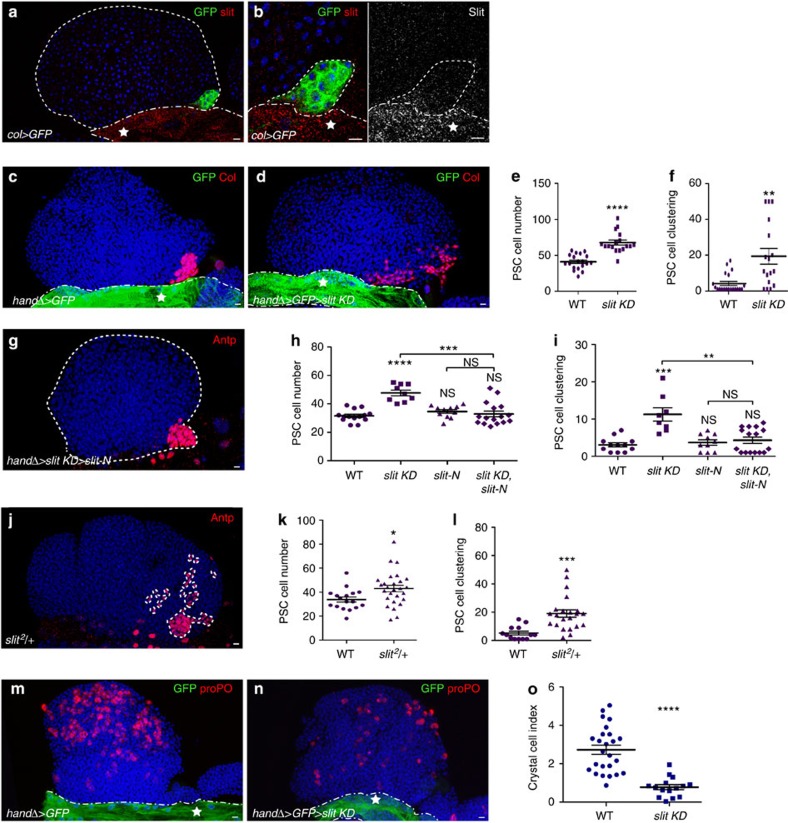
Figure 3. Slit expressed in the cardiac tube is required to control PSC morphology.
(a,b) PSC cells express GFP (col>GFP, green) under the PSC col driver. Slit (red in a and b and white in smaller right b) is expressed at high levels in the cardiac tube indicated by a star. (b) Enlarged views showing weak Slit expression in PSC cells (red and white left and right panels, respectively). (c,d) PSC cells are labelled by Col (red) and the cardiac tube expresses GFP under the control of the cardiac tube driver handΔ (handΔ>GFP, green). Compared with control (c), reducing Slit levels in the cardiac tube leads to an increased number of PSC cells and the loss of their clustering (d). (e,f) Quantification of PSC cell numbers and PSC cell clustering, respectively. (g) Antp (red) labels PSC in handΔ>slit KD>Slit-N. The slit KD PSC defect is rescued by Slit-N overexpression in the CT. (h,i) Quantification of PSC cell numbers (h) and PSC cell clustering (i); * corresponds to the comparison with WT, whereas * above a bar indicates the two conditions being compared. (j) Antp (red) labels the PSC in slit2/+ heterozygote mutant. (k,l) Quantification of PSC cell numbers (k) and PSC cell clustering (l). (m,n) Crystal cells are labelled by prophenoloxidase (proPO) antibody (red) and the cardiac tube expresses GFP (handΔ>GFP, green) under the control of the cardiac tube driver HandΔ. Fewer crystal cells differentiate in LGs, when slit expression is decreased in the cardiac tube (n), compared with WT (m). (o) Crystal cell index in m and n contexts. Statistical analysis t-test (Mann–Whitney nonparametric test) was performed using GraphPad Prism 5 software. Scale bars, 10 μm.

