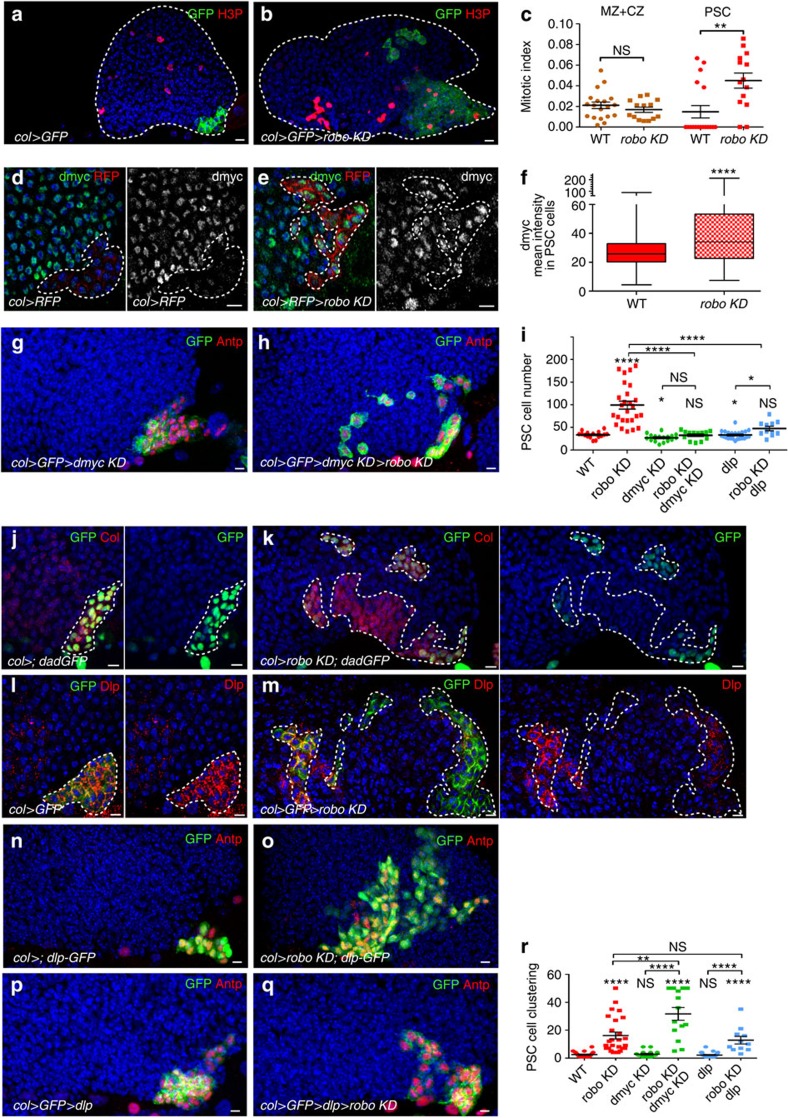
Figure 4. Robo receptors in the PSC control PSC cell proliferation through the activation of the BMP/Dpp signalling pathway.
(a,b) Phosphor-histone H3 (H3P) staining (red) in the presence or absence of robos in PSC cells (green). (c) Mitotic index in the (MZ+CZ), and PSC in WT and robo KD LG. (d–e) PSC cells express RFP (red) under the PSC col driver in WT (d) and in robo KD (e). dmyc staining (green, small left panels and white small right panels. (f) Quantification of dmyc mean intensity in PSC cells in WT and in robo KD. (g,h) PSC cells are stained by Antp (red) and express GFP (Col>GFP, green). Reduction of dmyc expression in the PSC (g) slightly reduces the number of PSC cells; dmyc reduction in the robo KD PSC rescues the number of PSC cells, but not their clustering (h). (i,r) Quantification of PSC cell numbers (i) and PSC cell clustering (r) under various mutant conditions. (j,k) Daughters against dpp-GFP (dad-GFP, green) are expressed in PSC cells labelled by Col (red). Compared with WT (j) robo KD PSC (k) expresses a lower level of dad-GFP. (l,m) Dally-like (dlp, red) is expressed in PSC cells labelled by GFP (green). Compared with control (l), robo KD PSC (m) expresses a lower level of Dlp. (n,o) PSC cells express GFP (green) and are stained by Antp (red). (p,q) Antp (red) and Dlp-GFP (green) label PSC cells in WT (p) and robo KD (q). All PSC cells express GFP both in WT and robo KD. The overexpression of Dlp in the PSC slightly reduces the number of PSC cells (i,r); in robo KD, this restores a WT number of PSC cells, but not their clustering (i,p–r). Statistical analysis t-test (Mann–Whitney nonparametric test) is performed using GraphPad Prism 5 software. Scale bars, 10 μm.

