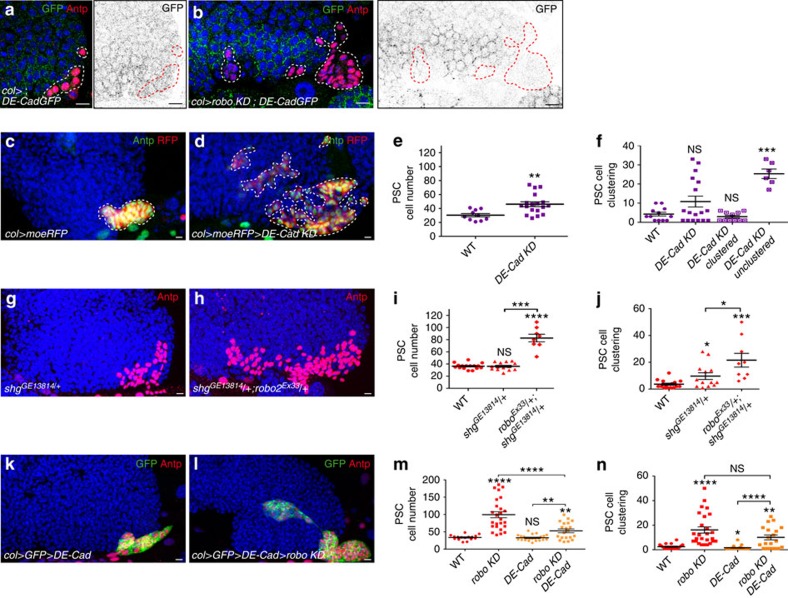
Figure 5. Robo receptors control the number and clustering of PSC cells via DE-cadherin.
(a,b) L2/early L3 LGs where DE-cadherin-GFP (green in left panels; black in right panels) is expressed in PSC cells labelled by Antp (red). Compared with WT (a) robo KD LGs (b) express a lower level of DE-cadherin-GFP in the PSC. (c,d) Antp (green) and RFP (col>moeRFP, red) label PSC cells in control (c) and in col>DE-cadherin KD PSC (d). (e,f,i,j,m,n) Quantification of PSC cell numbers (e,i,m) and PSC cell clustering (f,j,n) in various mutant conditions. Reduction of DE-cadherin in the PSC (d) leads to an increased number of PSC cells compared with control (c). Averaging the clustering of all DE-Cad KD LGs (n=44 lobes) does not reveal a significant clustering defect. However, these LGs can be divided into two classes: clustered (66%) and unclustered (33%), revealing a clustering defect (f). (g,h) Antp (red) labels the PSC in DE-cadherin mutant (shotgun, shg) shgGE13814/+ heterozygote (g) and shgGE13814/+; robo2EX33/+ trans-heterozygote mutant (h). A stronger PSC defect is observed in shgGE13814/+; robo2EX33/+ trans-heterozygote compared with the single shgGE13814/+ heterozygote mutant. For robo2Ex33/+ trans-heterozygote mutant, analysed in parallel to shgGE13814/+; robo2EX33/+ trans-heterozygote, the quantification of PSC cell numbers and clustering for robo2Ex33/+ heterozygote is given in Fig. 1c,d. (k,l) Antp (red) and GFP (green) label PSC cells when DE-cadherin (DE-Cad) is overexpressed (k) or when robo KD and DE-cadherin are co-expressed in the PSC (l). Statistical analysis t-test (Mann–Whitney nonparametric test) is performed using GraphPad Prism 5 software.

