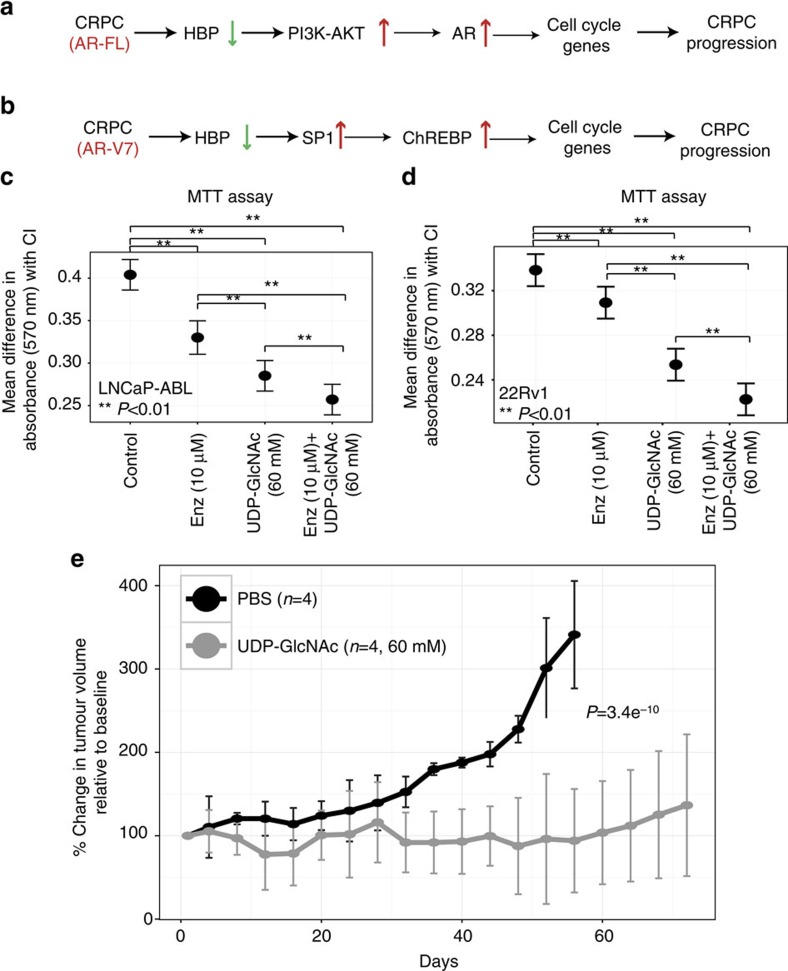
Figure 4. Therapeutic targeting of HBP in CRPC.
(a) Decreased HBP expression in CRPC tumours containing AR-FL is associated with increased activity of PI3K-AKT that could activate AR. This activates cell cycle genes leading to increased proliferation driving CRPC progression. (b) In CRPC containing AR-V7, decreased HBP expression activates SP1-regulated ChREBP expression leading to stimulation of cell cycle genes, increased proliferation and tumour progression. (c) MTT assay results for LNCaP-ABL (n=9) cells treated with vehicle (PBS+dimethylsulphoxide) or 10 μM enzalutamide (Enz) or 60 mM UDP-N-acetylglucosamine (UDP-GlcNAc) or both enz+UDP-GlcNAc for 96 h. (d) Same as in c but treatments were done on 22Rv1 cells (n=8). In both c and d, differences in the level of mean absorbance with corresponding confidence interval (CI) to control obtained for each of the conditions (x axis) is represented on the y axis. Comparisons of all treatments with control group in c,d were significant at a P-value of 0.01 (Bonferroni corrected). Pairwise comparisons of either Enz or combination of Enz+UDP-GlcNAc with other treatments were significant at a P-value<0.05. Treatment with Enz resulted in a modest to pronounced decrease in proliferation of 22Rv1 and LNCaP-ABL cells, respectively. Compared with Enz, treatment with UDP-GlcNAc alone resulted in a significant reduction in cell proliferation in both the CRPC-like cells. Furthermore, the effect of Enz+UDP-GlcNAc was significantly higher in CRPC-like cells, compared with any single treatment. Error bars represent s.e.m. (e) Plot showing rate of growth of LNCAP-ABL xenograft tumours (set 1, see the Methods for details) treated bi-weekly with either 60 mM UDP-GlcNAc (grey lines, n=4 mice) or PBS (black lines, n=4 mice), for a period of 72 days. For each animal, the tumour volume at each time point was normalized to its baseline value obtained before starting the treatment. The percent change in tumour volume for all the animals in group was calculated along with the associated median absolute deviation (MAD) and plotted against time (in days). P-value was calculated using GLM model as described in the text. Importantly, mice treated with UDP-GlcNAc showed a significant reduction in rate of tumour growth compared with the control-treated tumours (P-value=3.4e−10). Error bars represent MAD.

