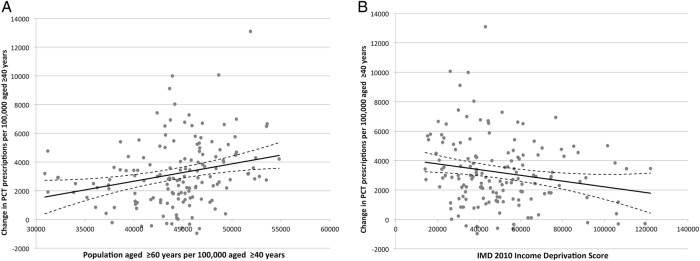
Figure 5.
Univariable linear regression plots showing correlation between (A) change in glaucoma/OHT prescriptions per 100 000 aged ≥40 years with population aged ≥60 years per 100 000 aged ≥40 years; (B) change in glaucoma/OHT prescriptions per 100 000 aged ≥40 years with income deprivation. Ninety-five per cent CIs of the regression lines are indicated by broken lines. IMD, Index of Multiple Deprivation; OHT, ocular hypertension; PCT, primary care trust.

