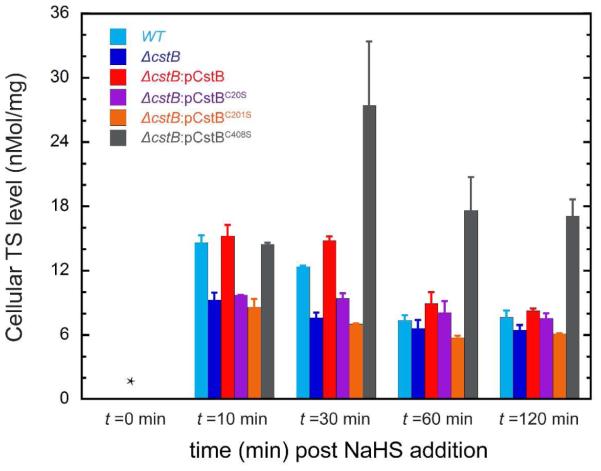
Figure 8.
Cellular thiosulfate concentrations in mid-log (OD600 ≈0.2) wild-type (WT), ΔcstB, and plasmid-complemented ΔcstB allelic S. aureus Newman strains as a function of time following induction of the cst operon at t=0 by 0.2 mM NaHS.15 *, no TS detected (≤0.2 nmol/mg protein). The color of the columns is assigned as follows: cyan for WT strain, blue for ΔcstB strain, red for ΔcstB:pCstB strain, purple for ΔcstB:pCstBC20S strain, orange for ΔcstB:pCstBC201S strain and grey for ΔcstB:pCstBC408S strain.

