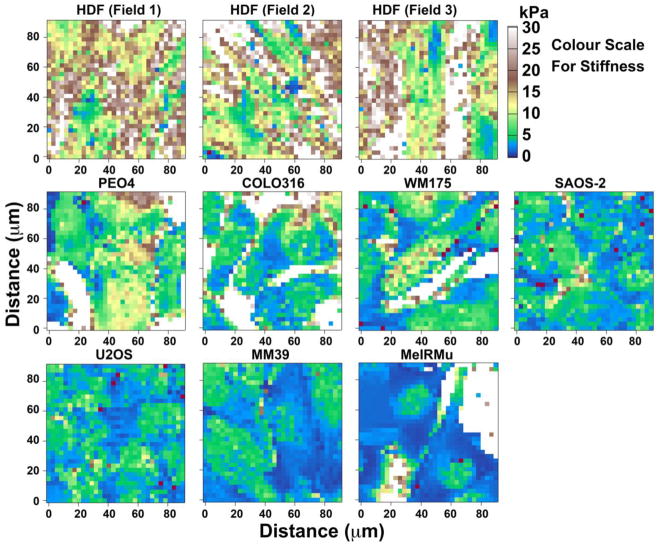
Fig. 4.
Atomic force microscopy stiffness maps of the same 90 μm square fields shown in Fig. 2, comprising three separate representative fields of HDF, and single fields of the malignant cells: PEO4, COLO316, WM175, SAOS-2, U2OS, MM39 and MeIRMu. Comparison of maps with the colour scale demonstrates HGF to be significantly more stiff compared with the malignant cell lines studied. Zones marked red were deemed unreliable for the purposes of analysis due to non-linearity of stress-strain measurements, and were thus excluded from the data. Areas marked white were recognized as often comprising culture plastic not covered by cellular material.

